May 2018
By B. Monrabal, A. Ortín, P. del Hierro. Polymer Char, Valencia, Spain.
Melt Index and density have not changed, so why is the “same” resin performing differently? Will a competitor resin with the same Melt Index and density perform equally? I am recycling polyolefin resins. How can I optimize my product’s performance? The resin I have used in the past is now performing/processing differently, why?
Introduction
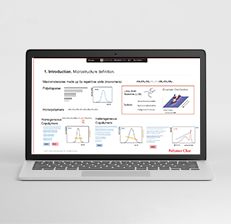
The introduction of single-site catalysts and the use of multiple reactors in the polyolefin industry has opened new routes to design resins with the desirable microstructure to optimize performance in specific applications. While this is good news for manufacturing, it presents a greater challenge for quality control because the currently used parameters show only partial information of the resin’s microstructure.
Melt Index (MI) and density are common parameters in process control and product definition that represent average molar mass and average composition respectively. However, with today’s sophisticated industrial polymers, these parameters are very far from defining resin performance. A set of analytical techniques has been recently developed to detail additional parameters relevant to the resin’s performance.
Same Resins, Different Performance?
Within the Polyethylene (PE) family, the additional parameters are essential, especially in the case of dual reactor resins, as with pipe and blow molding products, or in the broad spectrum of linear low-density polyethylene (LLDPE) resins.
Figure 1 shows three different PE that, in spite of having the same Melt Index, they have completely different Molar Mass Distributions (MMD), and thus, completely different performance and processing behavior. This reveals that a separation technique such as Gel Permeation/Size Exclusion Chromatography (GPC/SEC) is needed to have an unequivocal characterization of the resin’s chemical structure. These techniques, which in the past demanded operation expertise and sophisticated equipment, are available today with a simplified design for quality control purposes (GPC-QC).
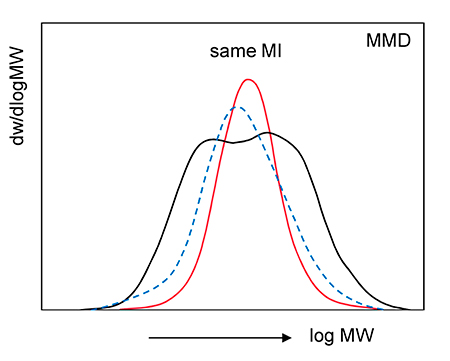
Figure 1.- Three different resins with the same Melt Index but completely different Molar Mass Distribution and therefore, different performance.
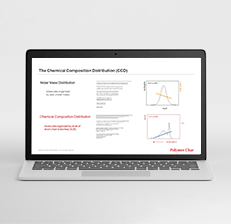
A similar situation is that of PE copolymers, such as the three LLDPE resins shown in Figure 2. They all have the same comonomer content, expressed with the density parameter, but reveal completely different Chemical Composition Distribution (CCD) and thus, different performance and processing behavior. Once more, this shows that a separation technique is demanded to have unequivocal characterization; in this case, using Temperature Rising Elution Fractionation (TREF), Crystallization Analysis Fractionation (CRYSTAF) or Crystallization Elution Fractionation (CEF).
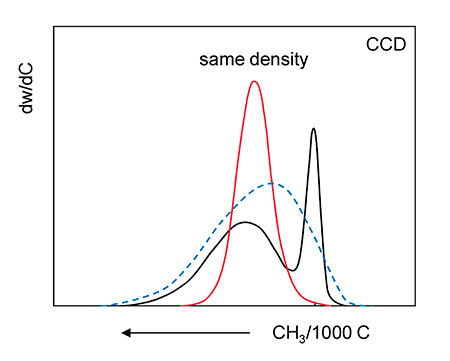
Figure 2.- Three different PE resins with the same density but completely different Chemical Composition Distribution and therefore, different performance.
Improving Performance by Fully Revealing the resin’s microstructure
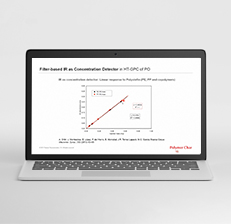
Although MMD and CCD represent the most significant microstructural information, on occasions, this data alone is not enough due to the interdependence of molar mass and composition. A good example is that of Pipe resins, which contain small amounts of comonomer but, for good performance, the comonomer (branching) is required to be incorporated within the larger molecules. The analysis of branching at different molar masses can now be obtained in a quality control lab by a simplified but sensitive GPC system with an additional IR composition sensor (GPC-QC IR5).
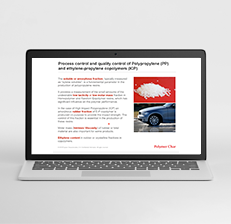
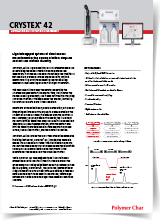
Within the Polypropylene (PP) family, the most demanding structure is that of heterophasic or High Impact Polypropylene (HIPP). The routine analysis of the amorphous content (or “xylene solubles” test) is important, but the analysis of the ethylene content and intrinsic viscosity in the two phases (crystalline and amorphous) provides additional information that can be critical to optimize the product’s performance. Soluble fraction, ethylene content and intrinsic viscosity parameters can now be obtained automatically with the new CRYSTEX instrumentation based on a TREF separation process (CRYSTEX QC and CRYSTEX 42).
No Longer a Nice-to-have, Now a Must-have in Production
The increasing throughput of the new polyolefin manufacturing plants and the incorporation of complex multiple reactor-catalyst processes demand a closer control of the microstructure to prevent product variation with significant losses in off-grade production. The analysis of average properties such as MI, density, and amorphous fractions by rheological or spectroscopic techniques, although important in stable process conditions, on many occasions is not enough. The measurement of the distributions or additional parameters by separation techniques such as GPC-QC or CRYSTEX® QC is required. This is especially important during grade changes, where reaching the desired microstructure in the shortest possible time is crucial to reduce off-grade production. Simplified separation techniques capable of obtaining results in a short time are essential.
The industry has also shown an increased interest and production of very high and Ultra High Molar Mass (UHMW) resins in the last years. However, a full characterization of these resins is a challenging task and demands method and materials adaptation to prevent precipitation of the resin in the analytical process. The GPC-QC at low flow rate, has been developed to analyze the MMD of very high molar mass resins, one at a time. Additionally, a dedicated Intrinsic Viscosity Analyzer (IVA) was also designed to automatically analyze multiple samples of UHMW resins through a capillary relative viscometer without memory effects or plugging.
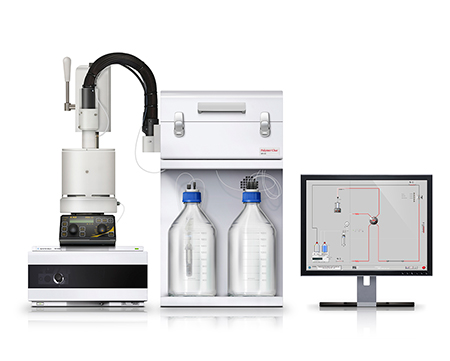
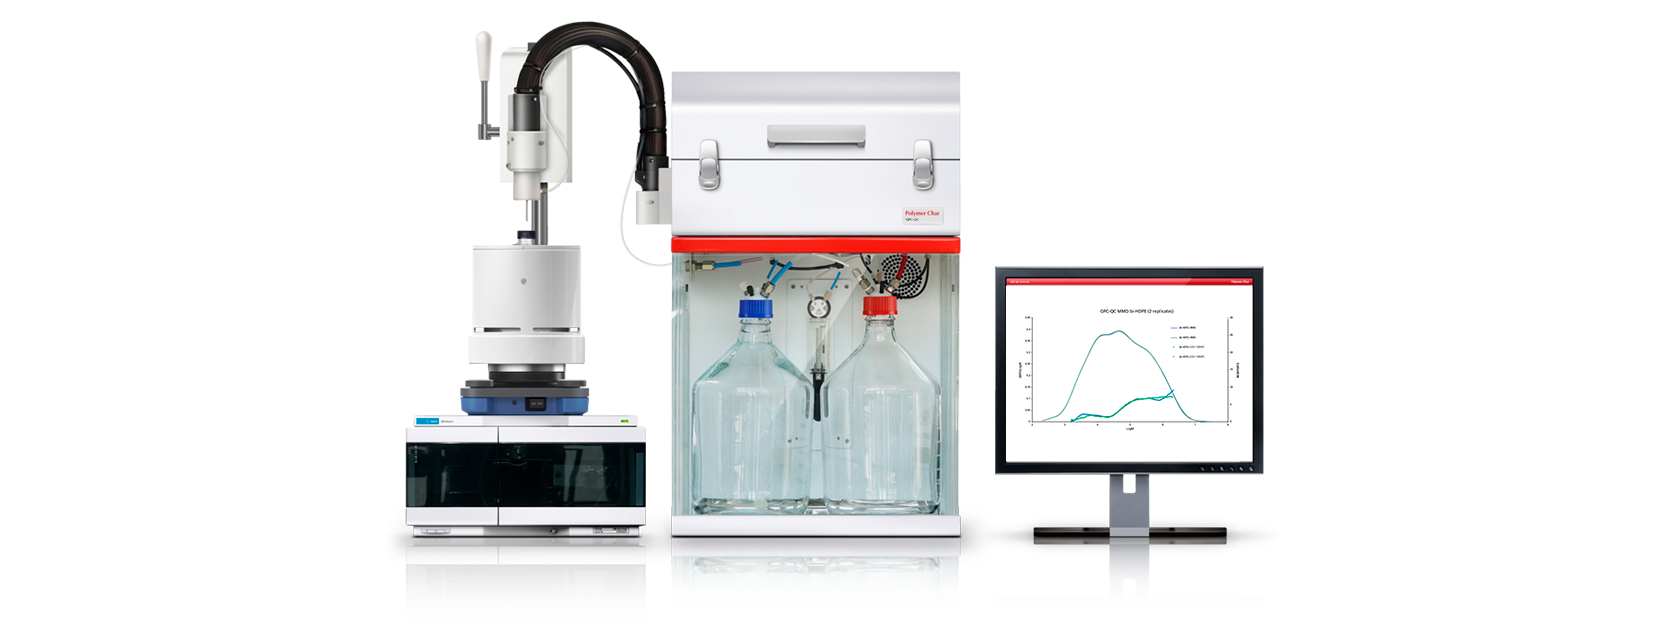
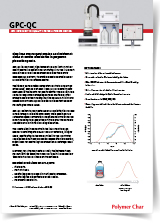
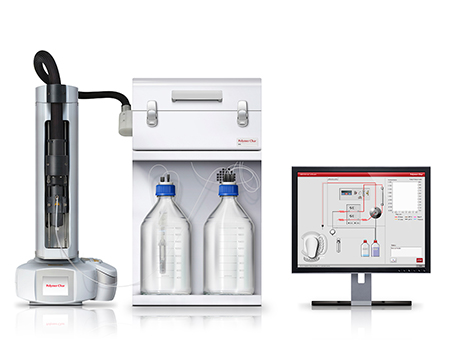
GPC-QC Instrument
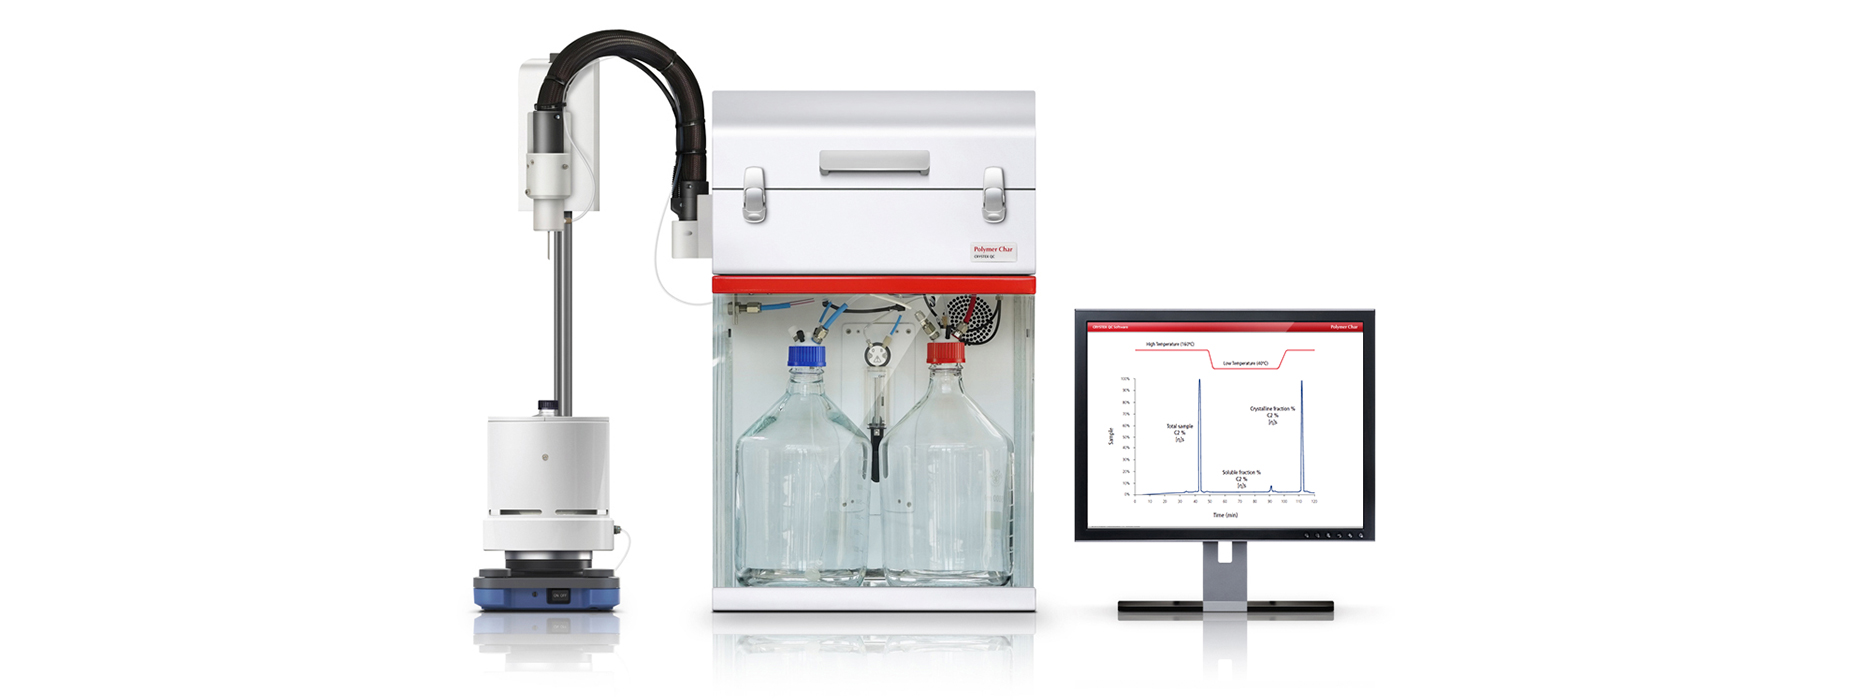
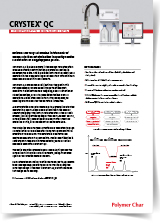
Unparalleled Separation of the Soluble Fraction in Polypropylene
CRYSTEX® QC is a fully-automated instrument that separates crystalline and amorphous fractions by means of a proprietary Temperature Rising Elution Fractionation (TREF) column where a small aliquot of the homogeneous polymer solution is crystallized, in di- or tri-chlorobenzene (o-DCB / TCB), on a support under reproducible and well-controlled conditions. The polymer solution is loaded into the column at elevated temperature; it is crystallized to near ambient temperature with no flow and then the solvent is moved through the column to elute the amorphous soluble material towards the online detectors. Finally, the column temperature is increased again to re-dissolve the crystalline material which is eventually eluted to the detectors.
The analytical workflow is also very simple: all the analyst is required to do is put an approximate amount of sample in a disposable bottle, place it in the stirred-heated plate, and lower a handle to pierce the bottle’s septum with a needle (Figure 3). The automated process proceeds under computer control, including filling the bottle with pre-heated solvent, controlling the dissolution time, temperature and stirring, and taking an aliquot of the solution from the bottle into the instrument’s column.
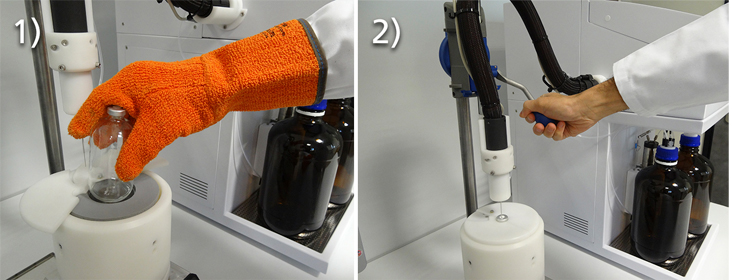
Figure 3. Safe and efficient operation of the single-sample dissolution station in GPC-QC and CRYSTEX® QC instruments: 1) Remove the previous bottle and place a new one with an approximate sample weight; 2) Manual Injection and press START
The amorphous/crystalline fractions are quantified with a sensitive filter-type Infrared (IR) detector that delivers equivalent values to the xylene solubles test, obtained with outstanding precision. In addition, the IR detector measures the ethylene incorporation in the case of copolymers. The integration of a capillary viscometer provides automated measurement of intrinsic viscosity of the whole sample and both amorphous and crystalline fractions.
Table 1 shows data obtained from seven replicate analyses using a four-gram sample for a set of three polypropylene products with average standard deviations shown for each type of measurement. No additional experimental effort is required, since all the data is collected by the IR and viscometer detectors during the automated analysis, with one equipment in a single 2-hour experiment.
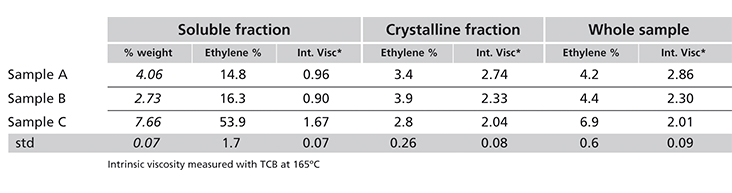
Table 1. Analysis of amorphous/crystalline fractions of three polypropylene products by CRYSTEX® QC.
GPC/SEC for Quality Control and Process Control in PE and PP Manufacturing
The GPC-QC instrument is built with the same single-sample dissolution station described above, and simplified hardware design including only one valve at high temperature, an external HPLC pump and, robust detectors, which help in achieving the required level of reliability and minimizing potential downtime. The main detector is infrared, which provides a concentration signal based on the absorbance of total CH, being very appropriate for a QC environment thanks to the fast stabilization time, stable baseline, and good sensitivity. In addition, IR detection provides complementary information on chemical composition (Short-chain Branching (SCB), or comonomer content) along the MMD.
The analytical workflow is quite simple and requires minimum manual work. When a sample of polymer is received in the laboratory, it is weighed into a disposable bottle that is placed into the dissolution station oven. Then the analyst lowers a handle to insert the needle through the septum. The analysis is started from the computer and proceeds automatically according to the pre-set method conditions. Once the analysis is finished, the chromatograms are processed to generate the MMD and any calculated parameters of interest. When a new sample comes in, a new bottle is prepared with it and the analyst just discards the previous one placing the new one in the station. Following this workflow, the GPC-QC can be operated continuously with a cycle time of one hour or less, which is found appropriate for controlling the start-up of reactors, or when a change of grade is conducted. Once the process is stable, production may need to be controlled at a slower pace, one or several times per day.
An application example is provided in Figure 4 for a bimodal high-density polyethylene made in a dual-reactor process. A lower molar mass high-density component is typically produced, together with the second component of larger molar mass with a small amount of added comonomer. That balance results in enhanced mechanical properties, such as ESCR, for pipe applications. From a single GPC-QC analysis, and in less than one hour with minimum operator intervention, it is possible to obtain an estimation on the density being produced in each of the two reactors (based on measured SCB level), as well as the molar mass and the weight fraction of each component. The level of control of the process is thus, greatly enhanced over alternative methods based on bulk properties (MI and density).
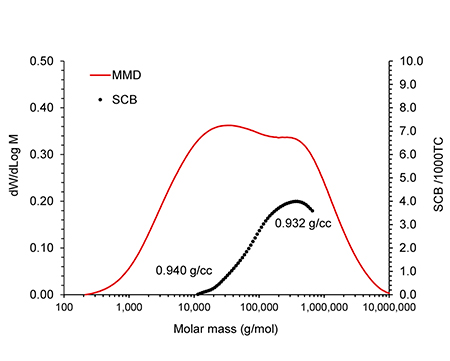
Figure 4. Molar Mass Distribution and Short-chain Branching frequency measured by GPC-QC for a bimodal HDPE. The density of each of the modes was calculated from an average of the SCB frequency in each molar mass range.
The optimized dissolution and separation processes open the door to high-temperature Gel Permeation Chromatography analysis within 30 minutes in most cases, including the sample preparation step with an efficient dissolution process under a nitrogen atmosphere, and less than one hour even for the most difficult products. This is a step forward in this kind of technology and enables its practical application in manufacturing plants as a process control /quality control tool.
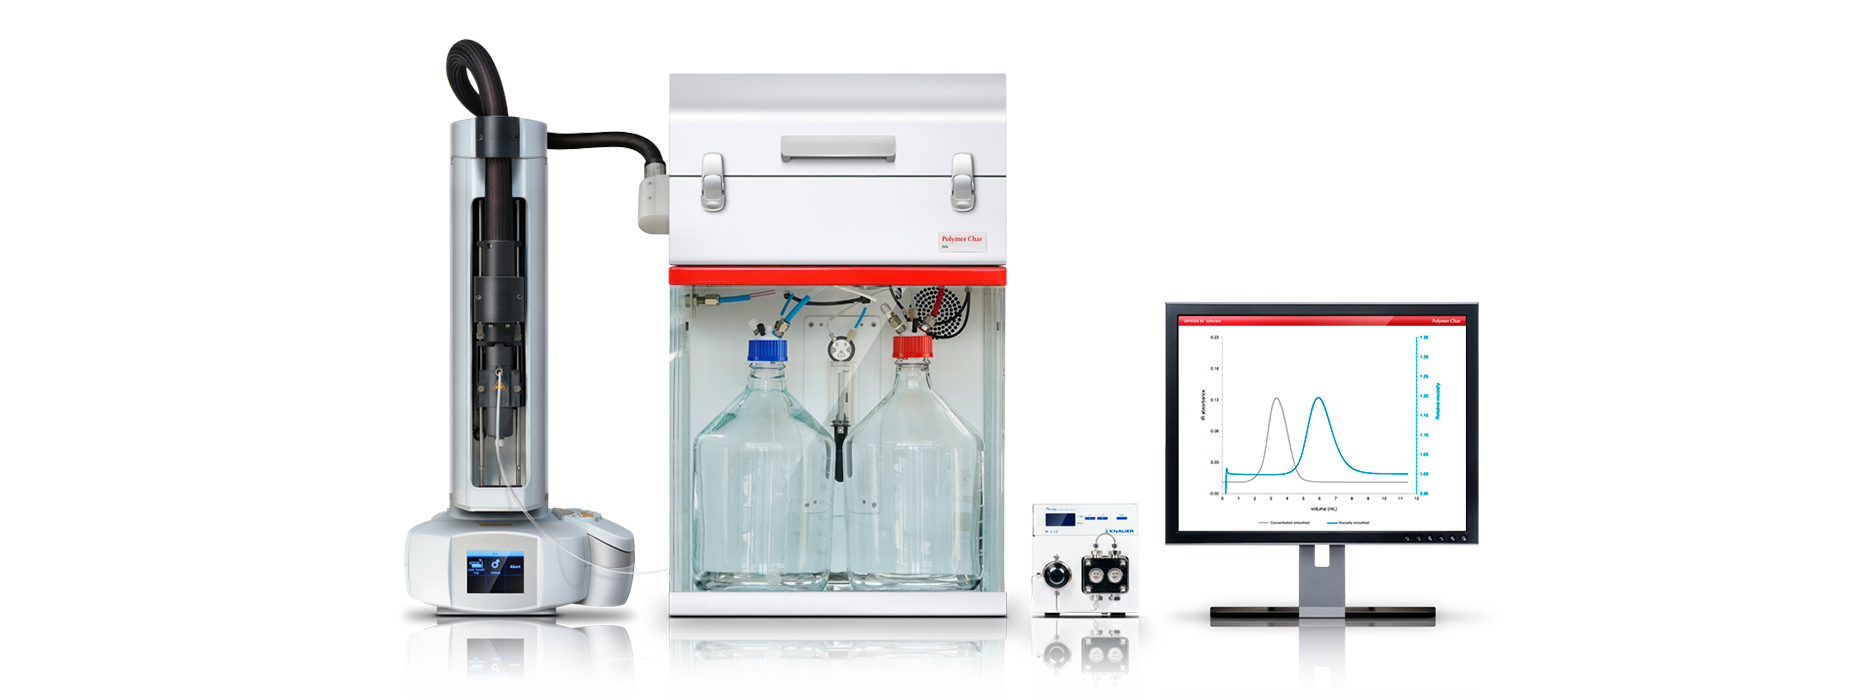
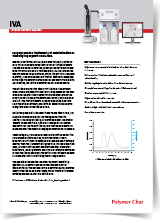
Measuring Intrinsic Viscosity of All Polymeric Materials
The Intrinsic Viscosity Analyzer (IVA) is an instrument designed for the analysis of the intrinsic viscosity of polymers, and it is based on the same QC platform. The relative viscosity of a dilute polymer solution with reference to the pure solvent is measured by means of a robust serial capillary viscometer. From it, the intrinsic viscosity of the polymer can be calculated using a single-point estimation method.
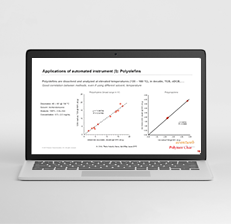
Due to the popularity of dilute solution viscosity measurements and the availability of such methods in many laboratories, the IV of polymers has been traditionally used to specify and to control production grades. Different polymers in various solvents have been analyzed in this system, including PAN (polyacrylonitrile) in DMF (N,N-dimethylformamide), PET polyethylene terephthalate) in phenol/o-DCB, PLA (polylactic acid) in TCB as well as polypropylene and polyethylene (even high and ultra-high molar mass) in TCB and o-DCB. The intrinsic viscosity results obtained by the IVA are in good agreement with reference methods (ISO 1628-3:2010 f.i. and ASTM D1601) in all cases.
Intrinsic Viscosity Analyzer
References:
Automated Soluble fraction analysis in PP (CRYSTEX® QC) – The Column (LC/GC), November 2013
Soluble fraction analysis in polypropylene for QC (CRYSTEX® QC) LCGC – LCGC EU and NA The Applications Notebook, December 2013
Gel Permeation Chromatography (GPC) for Process Control and Quality Control – The Column (LC/GC), September 2015
Solution Viscosity of Polymeric Materials by IVA – Petro Industry News, April/May Issue 2015