By A. Ortín, E. López, B. Monrabal. Polymer Char, Valencia, Spain.
Gel Permeation Chromatography as a new tool for process control and quality control in polyethylene and polypropylene manufacturing plants.
Introduction
Polyolefins constitute the world largest group of industrial polymers in terms of production and economic impact. They are used for making a wide range of commercial products that touch nearly every aspect of our daily lives, such as automobile parts, pipes, packaging films, household bottles, and many more. The polyolefin group includes high-density and low-density polyethylene (HDPE, LDPE), polypropylene (PP), ethylene-propylene (EP) rubber, and linear low density (LLDPE) copolymers of ethylene with alpha-olefins (propylene, 1-butene, 1-hexene, 1-octene). These are poly-disperse materials, meaning that a single product is made of a range of chains with different chain-lengths, and possibly different chemical compositions when more than one monomer type is used in the synthesis. Moreover, different molecular architectures (linear or branched) and stereo-structures (tacticity in PP) are also possible in these products. All that complexity, together with the semi-crystalline nature of most polyolefin materials, helps to understand the expanding application range of these products.
A range of reactor configurations and catalyst systems are used nowadays by different manufacturers to produce thousands of tons of polyethylene and polypropylene every year in huge petrochemical complexes around the world. Even if the material produced is in fact characterized by a distribution of molar masses (MMD), and possibly a distribution of chemical compositions (CCD), due to historical and practical reasons, the production is typically controlled based on bulk properties, which can be measured with relatively simple equipment. Melt Flow Index (MFI) is maybe the most important of such bulk parameters, being related mainly to the average molar mass. Density, which is more related to the average of chemical compositions, is another parameter typically used for controlling the reactor and the product.
With the development of more complex polyolefins, such a multimodal polyethylene or heterophasic polypropylene, and the requirement for a more uniform production and tighter specification ranges demanded by a global and competitive market, the classical approach of relying on bulk physical properties to control the manufacturing process starts to find its limits. A new paradigm needs to be implemented based on acquiring complete information about the full distributions that characterize the products, in order to replace or complement the control based on single average parameters.
Gel permeation chromatography (GPC/SEC) is extensively used in the industry’s analytical laboratories to obtain the MMD. The requirement of high temperature operation, given the semi-crystalline nature of polyolefins, together with the inherent complexity of the technique and the fragility of GPC columns, has prevented in the past the availability of MMD analysis as a routine process control tool in the manufacturing plant laboratory.
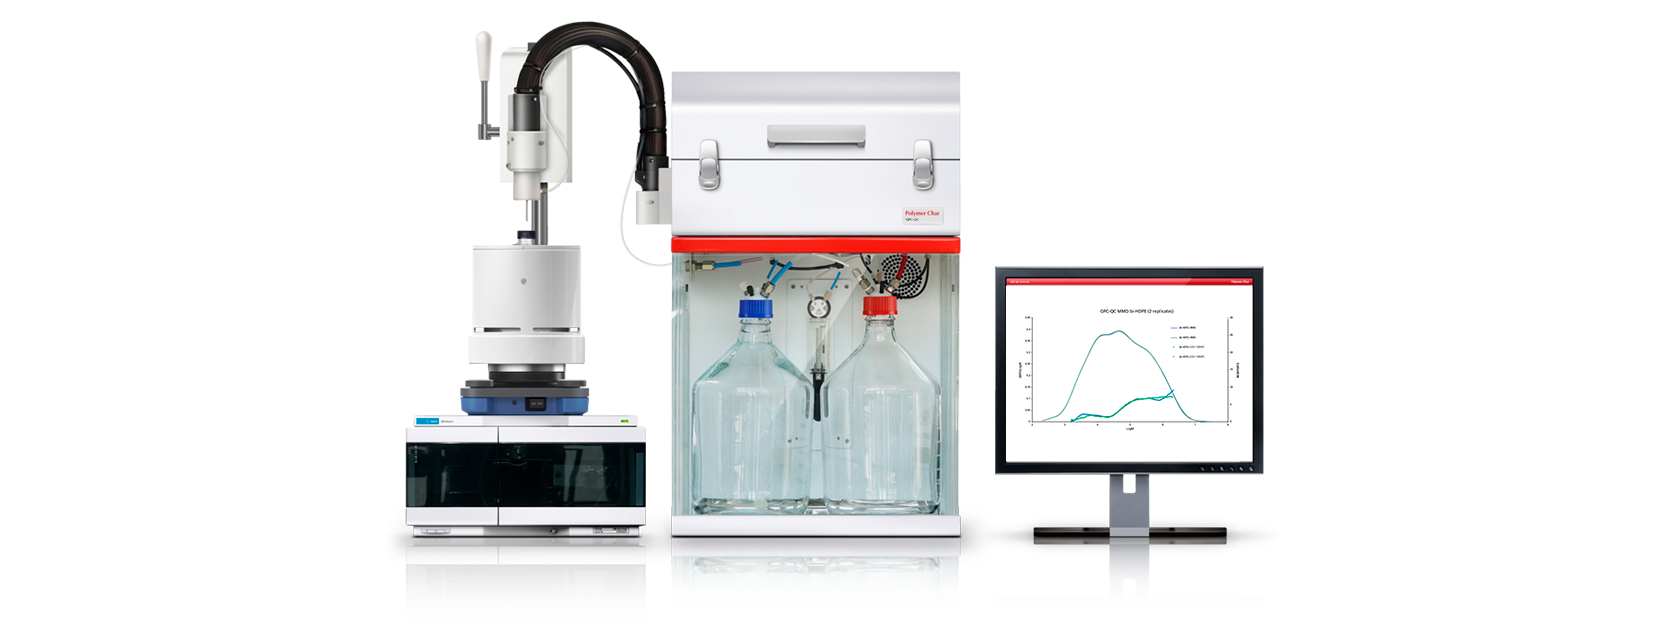
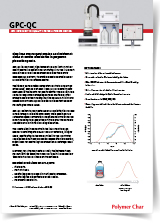
In order to fulfill this need in the industry, a compact GPC-QC instrument has been developed to provide robust and precise MMD data for process control. In addition to a high-reliability hardware design, the operation workflow has been simplified while keeping full automation of sample dissolution and analysis.
Design principles and operation
The application for GPC-QC is to follow the process changes in manufacturing. In this scenario there are no batches of samples coming together to be analyzed; instead, the analysis of a single sample of the material produced at a particular time is required, in a continuous operation cycle. This means that there is no need for an auto-sampler, but a single dissolution station optimized to shorten the dissolution time. This is a fundamental difference in the design of instrumentation for quality control, compared to the instrumentation dedicated to research.
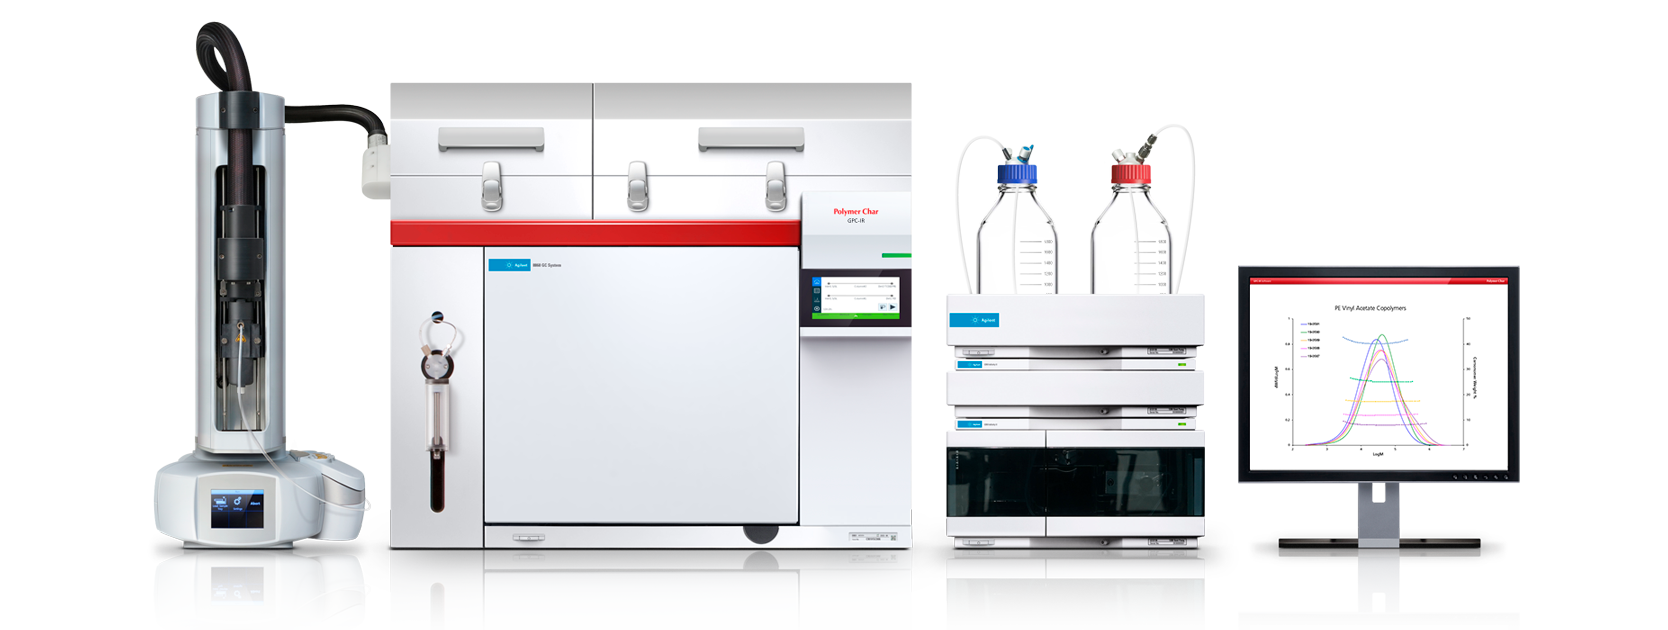
GPC-QC has a simplified hardware design including only one valve at high temperature, an external HPLC pump, and robust detectors, to help achieve the required level of reliability and minimize potential downtime. The main detector is Infrared (IR), which provides a concentration signal based on absorbance of total CH. Infrared technology is very appropriate for the QC environment thanks to its fast stabilization time, stable baseline, and good sensitivity.
Depending on the process homogeneity, a significant amount of sample may be required to obtain good representativeness, so large capacity vials of 100 or 200 mL are used, compared to the typical 2 – 10 mL used in research-grade instruments. Up to 200 mg of polymer can be dissolved for analysis, although 50 mg is the typical sample size.
The analytical workflow is quite simple and requires minimum manual work. When a sample of polymer is received in the laboratory, it is weighed into the vial and a small magnetic stirring bar is placed inside (a small amount of a flow rate marker, or internal standard, can be added to the vial). The vial is then placed in the dissolution station oven and the analyst lowers a handle to insert the needle into the vial through the septum. The analysis is started from the computer, and it proceeds automatically according to the pre‑set method conditions. Once the analysis is finished, the chromatograms are processed to generate the MMD and any calculated parameters of interest. When a new sample comes in, a new vial is prepared with it and the analyst just discards the previous one and places the new one in the dissolution station. Following this workflow, the GPC-QC can be operated continuously with a cycle time of one hour or less, which is found appropriate for controlling the start‑up of reactors, or when a change of grade is conducted. Once the process is stable, production may need to be controlled at a slower pace, several times per day.
Results and discussion
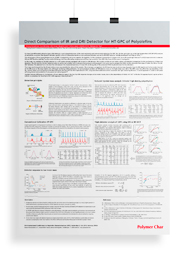
Precision in the molar mass results is key in the application of this technology in manufacturing control, so some experiments were conducted to assess whether the performance was satisfactory. A series of replicate analyses of an LLDPE material (density 0.868 g/cm3) were performed in a GPC-QC instrument, using typical analysis conditions: mobile phase was 1,2,4-trichlorobenzene (TCB) with 300 ppm of butylhydroxytoluene (BHT) as antioxidant, chromatographic pump flow rate of 2.0mL/min, column and detectors temperature 150ºC, injection 200 mL, and the column was a PL Rapide H 150 x 7.5 mm (Agilent, Waldbronn, Germany). For sample preparation, 40 mg of polymer were put in the vial and filling volume was set to 80 mL taken from the same reservoir as the mobile phase, dissolution time was 60 minutes at 160ºC with 400 rpm stirring.
The IR detector concentration chromatograms are shown in Figure 1 (left) for the seven replicates, which overlay perfectly. It should also be noted that the separation was achieved in a time slightly over 2 minutes. The total analysis time can be reduced to around 3 minutes, and solvent consumption to around 50 mL per sample.
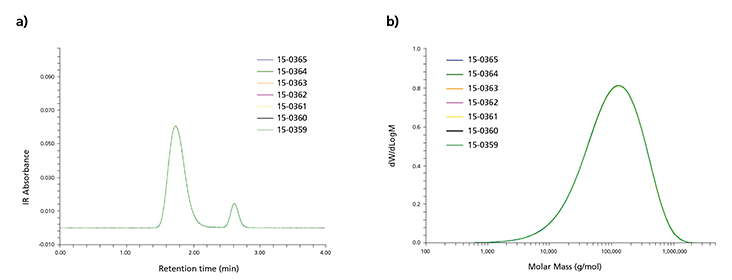
Figure 1. Chromatograms (left) and molar mass distribution (right) for seven injections of a PE sample, showing excellent precision in the injection and analysis process in GPC-QC. The smaller peak at 2.6 min is a flow rate marker.
The good precision in the collected chromatograms is translated to the calculated MMD as seen in the same Figure (right). The molar mass averages Mw and Mn from all individual distributions are presented in Table 1, together with the poly-dispersity index calculated as the ratio Mw/Mn. This index is related to the broadness of the distribution, and this information is not available when only bulk properties are measured. The precision in the molar mass averages and poly-dispersity index expressed as standard deviation (std) and relative standard deviation (RSD %) is remarkable for GPC analysis.