Table 1. Description of test samples used in this study
Experimental Conditions
- Eluent: TCB (stabilized with 300 ppm BHT).
- Columns: 3 × PLOlexis, 13 μm, 300 × 7.5 mm.
- Flow rate: 1.0 mL/min.
- Injection volume: 200 μL.
- Sample concentration: 2 mg/mL.
- Temperature: dissolution 160 °C; columns: 145 °C; detectors 160 °C; MALLS 150 °C.
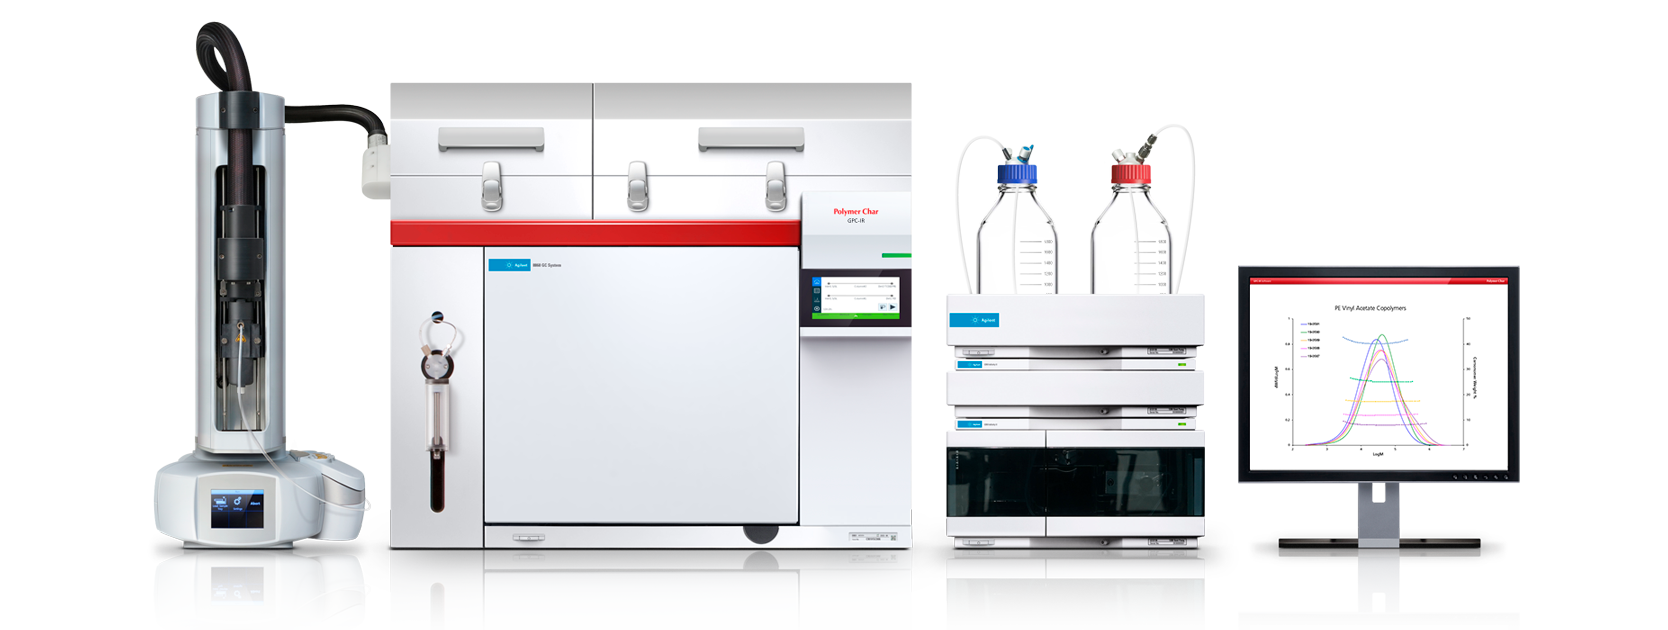
- Chromatographic system: GPC-IR by Polymer Char.
- Detectors: IR5 MCT infrared detector by Polymer Char. 4-capillary viscometer by Polymer Char. Multiple angle laser light scattering HELEOS™ 8+ by Wyatt Technology.
- Data handling: GPC One by Polymer Char.
Results and Discussion
- Ethylene-propylene Composition Analysis by GPC-IR5 MCT:
The MMD obtained by GPC-LS for the three samples in Table I is shown in Figure 1, where the IR5 MCT detector total CH channel is used to record the sample concentration across the GPC elution curve.
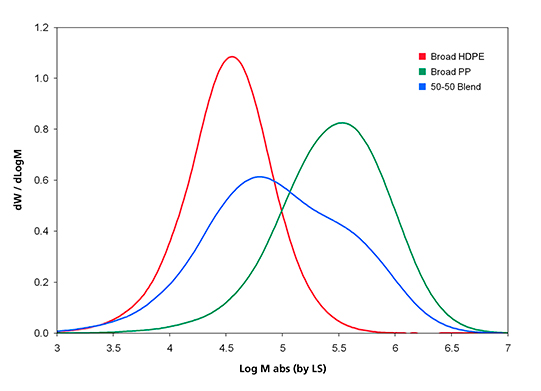
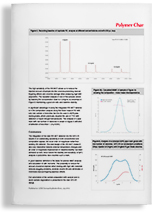
Figure 1. Molar Mass Distribution curves of the three samples analyzed
For studying chemical composition variation across the MMD, the combination of detector signals from the IR5 MCT methylene (CH2) and methyl (CH3) channels, shown in the bottom part of Figure 2, is used. Since the PP part in the blend sample is of higher MM than the PE part, a higher methyl signal is seen in the higher-MM end of the sample, as expected.
The trend of changing ethylene percent, seen in Figure 2, can be predicted a priori from the co-adding of the original PE and PP GPC elution curves. This ethylene to propylene transition also can be determined from the difference between the CH2 and CH3 signals of the IR5 MCT detector 1. The validity of this analytical approach is supported by the agreement seen in Figure 2 between the predicted and the IR5 MCT results.
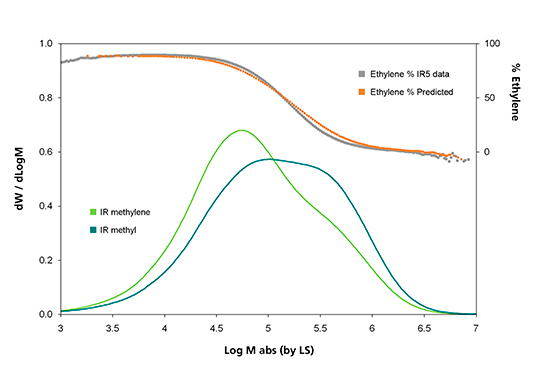
Figure 2. Analysis of the test blend sample. IR5 MCT CH2 and CH3 absorbance channels versus Log M (solid lines); Ethylene % variation across MMD, predicted versus IR5 MCT measured (top part)
- Ethylene-propylene Composition Analysis by TD-GPC:
In the triple detector GPC, the ratio of LS signal over sample concentration at each GPC elution volume gives a measure of the polymer weight-average MM (Mw). Similarly, the ratio of the viscosity detector signal over sample concentration gives the polymer Intrinsic Viscosity (IV). The plot of Log IV versus Log Mw by LS is called the Mark- Houwink (MH) plot, which is an often used tool to reveal polymer branching and conformational structures 3.
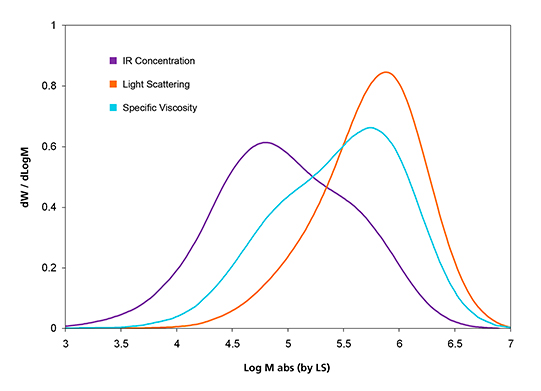
Figure 3. Triple-detector signal overlay of the test blend sample.
Both light scattering and viscosity detector signals are more responsive to higher MM molecules. This is the reason that the LS and viscosity curves of the blend sample are skewed more to the higher MM region than the IR concentration curve shown in Figure 3.
The corresponding MH plots for the three samples are shown in Figure 4. The MH line of the PP sample is seen to have a shift to higher MM from that of the PE sample. This is because of the extra methyl group off the chain backbone that leads to higher MM and lower IV for the PP sample. The MH plot of the blend sample in Figure 4 is seen to go through a transition from the PE line to the PP line as the MM increases. The experimental data agrees with the predicted curve very well. This agreement supports the use of TD-GPC for studying polymer blends and block copolymers of EP, PE, EO (ethylene/ octene), and so on.
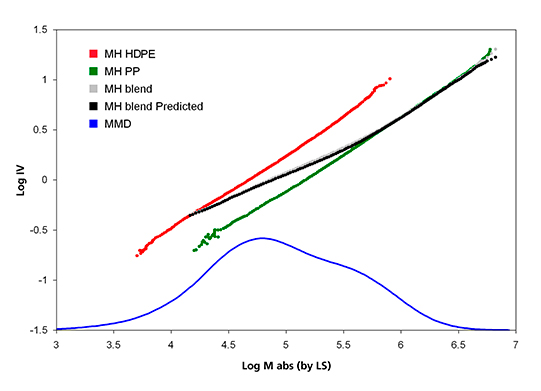
Figure 4. Mark-Houwink plot of homopolymer PP, HDPE, and their blend.
Conclusions
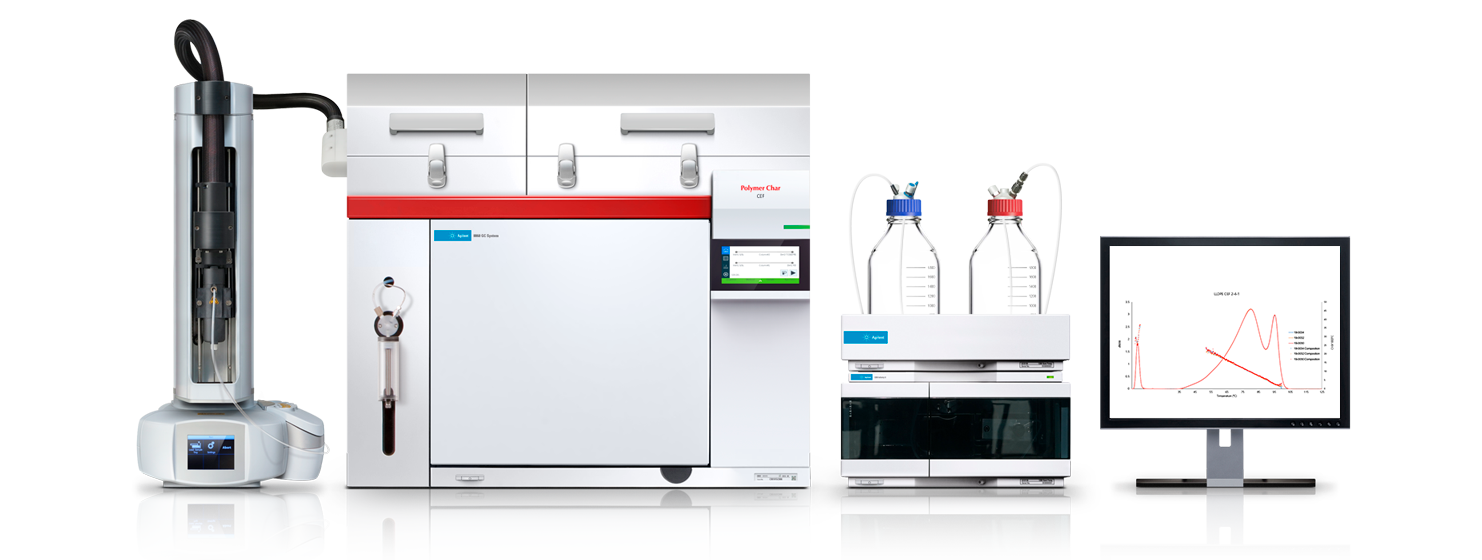
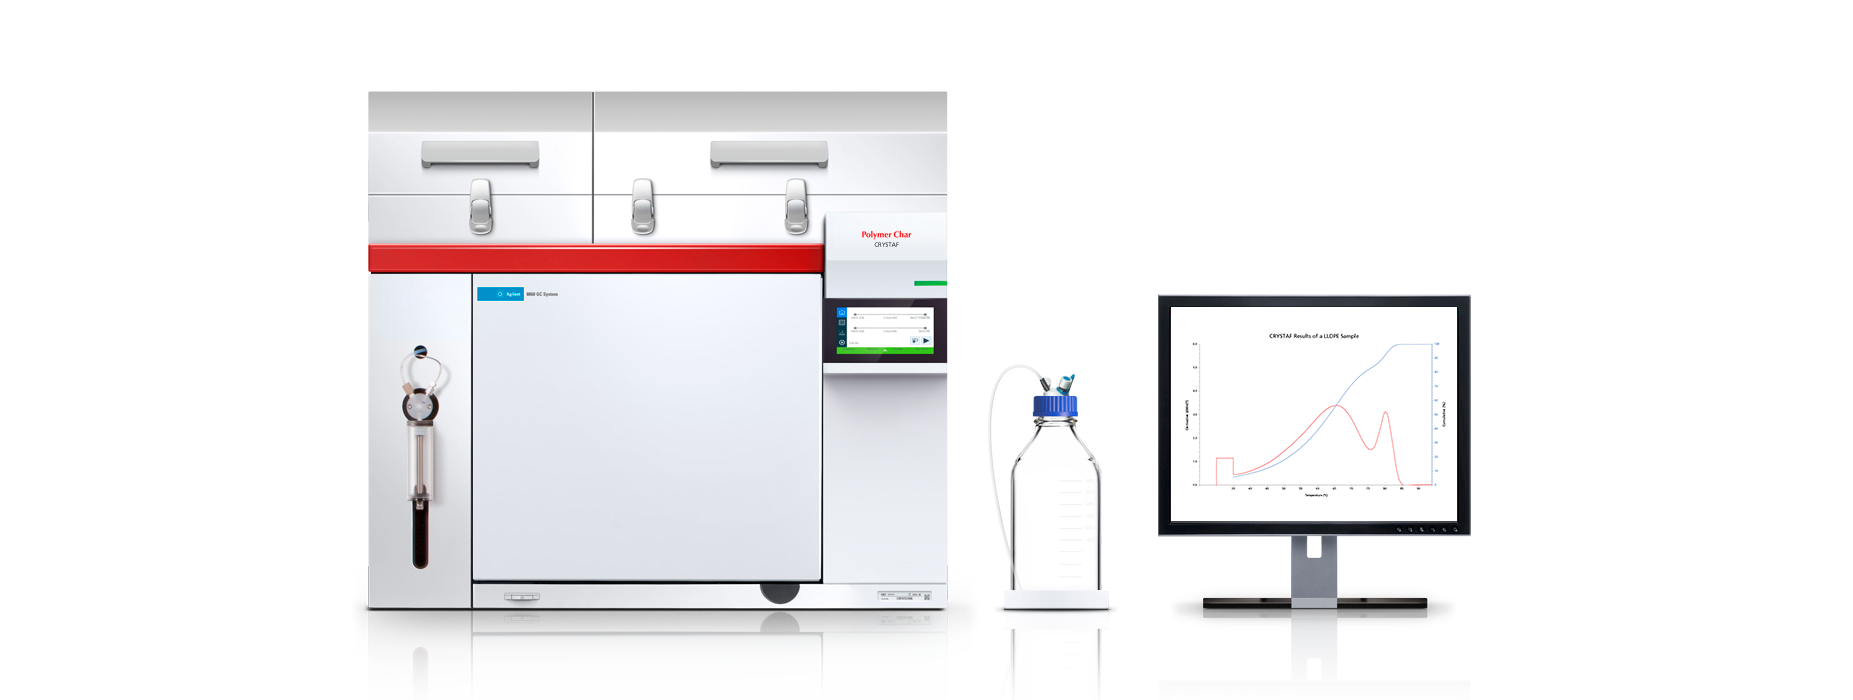
The micro-structural difference of Polyethylene and Polypropylene as well as the compositional variation in EP can be detected by GPC-IR5 MCT and TD-GPC, as it has been validated by using a test sample of known composition created by a 50-50 PE-PP blend. This result of SCB variation across MMD provides the additional polymer structural information that complements perfectly the CRYSTAF (crystallization analysis fractionation), TREF (temperature rising elution fractionation), and CEF (crystallization elution fractionation) results which give SCB distribution across the crystallization temperatures 3-5 and to the cross-fractionaton technique 6.
References
1 J. Montesinos, R. Tarín, A. Ortín, and B. Monrabal. ICPC 2006 Houston.
2 A. M. Striegel et al., Modern Size-Exclusion Liquid Chromatography, Wiley, New York, (2009).
3 W. W. Yau and D. Gillespie, Polymer 42, 8947–8958 (2001)
4 B. Monrabal, in “Encyclopedia of Analytical Chemistry”, R. A. Meyers, Ed., John Wiley & Sons Ltd., (2000).
5 B. Monrabal, L. Romero, N. Mayo, and J. Sancho-Tello, Macromolecular Symposia 282, 14–24 (2009).
6 A. Ortin, B. Monrabal, and J. Sancho-Tello, Macromolecular Symposia 257, 13–28 (2007).