November 2011
By A. Ortín, B. Monrabal, J. Montesinos, P. Del Hierro, N. Mayo. Polymer Char, Valencia, Spain.
Introduction
The analysis of the molecular weight distribution of polyethylene and polypropylene resins by Gel Permeation Chromatography (GPC), or Size Exclusion Chromatography (SEC), has always been considered a demanding task. Using multiple detection methods (with online viscometer and light scattering detectors) maximize the information on the polymer microstructure. A high-quality concentration signal is of paramount importance for the reliable application of those methods, in order to obtain accurate and precise information. Recent developments in online Infrared (IR) detection have meant a breakthrough in concentration detection for polyolefin applications, greatly improving the quality of data by those multiple detection methods. Highly sensitive and stable Polymer Char’s IR4 and IR5 MCT filter based IR detectors are now a convenient alternative to other concentration detection techniques, also providing superior performance.
In this document, data collected from IR detectors based on narrow band interference filters to select specific wavelengths is presented. The main advantages of the filter-based IR technique as concentration detection for GPC/SEC analysis of polyolefins are summarized: high sensitivity, superb stability, ability to work in staggered injection mode, low detection limit. In addition, this IR detection technology is also capable of detecting chemical composition, so short chain branching is quantified with high sensitivity across the molar mass distribution, complementing the microstructure information gathered in the GPC/SEC analysis.
Experimental
Instrument:
- GPC-IR high-temperature GPC instrument, by Polymer Char.
Detectors:
- Concentration and composition: IR5 MCT Infrared detector, by Polymer Char, equipped with narrow band optical filters in the C-H stretching region at 2800─3000cm-1. Cell volume 11µL, high-temperature flow-through cell.
- Light scattering: HELEOS 8, by Wyatt Technology.
- Viscometer: GPC-IR built-in 4-capillary bridge.
Typical sample preparation:
- 8.0mg of polymer sample, in 8.0mL solvent.
- Solvent: TCB, 300ppm BHT antioxidant, used for sample dissolution and as mobile phase.
- Process automated in the GPC-IR autosampler: 1 hour at 160ºC in the autosampler oven with gentle shaking, vials stay in room temperature area until dissolution time. Nitrogen purge in the vial to reduce sample degradation.
- GPC Analysis: Injection: 200µL,1.0mg/mL flow rate 1.0mL/min, columns temperature 145ºC, 3 mixed bed 13 micron GPC columns TSKgel GMHHR-H(S) – HT Tosoh Bioscience, Germany.
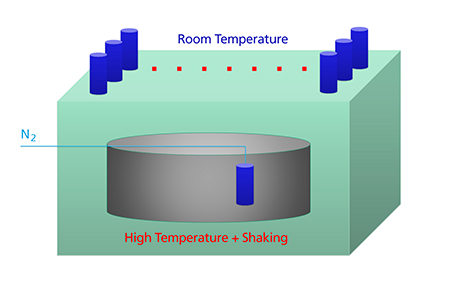
Figure 1. GPC-IR preparation system minimizes sample degradation.
Concentration Detector
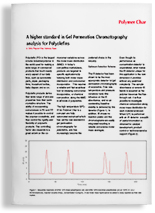
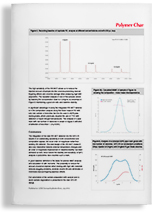
Filter based Infrared detection is a very robust technique, not being affected by pressure changes, injection ghost peaks, temperature variations or other external variables. Very clean chromatograms on a highly stable baseline are collected when using this type of IR detector as seen in Figure 5, simplifying the task of setting the integration limits and performing baseline correction either manually or when using automated software algorithms. A high-quality concentration signal together with fully automated sample preparation results in enhanced reproducibility (Figure 2).
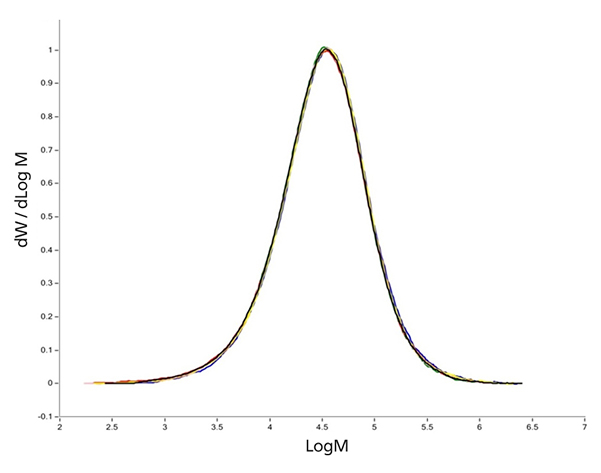
Figure 2. Molecular weight distribution of seven different injections of PE copolymer analyzed by GPC under standard conditions with IR detector.
In polyolefin analysis, the IR detection provides high sensitivity not influenced by the rather low dn/dc values found in these polymers. This high sensitivity together with the low noise achieved in modern filter-based IR detectors results in superb signal to noise ratio. In GPC/SEC of polyolefins it is always desirable, and in some applications required, to reduce the polymer injected mass in order to obtain accurate molar mass distributions. This is the case when very high molar mass fractions are present in the sample. Filter-based IR detectors, such as Polymer Char’s IR5 MCT detector, can work successfully even when very low mass is injected, providing good quality chromatograms thanks to its low detection limit (Figures 3, 4a and 4b).
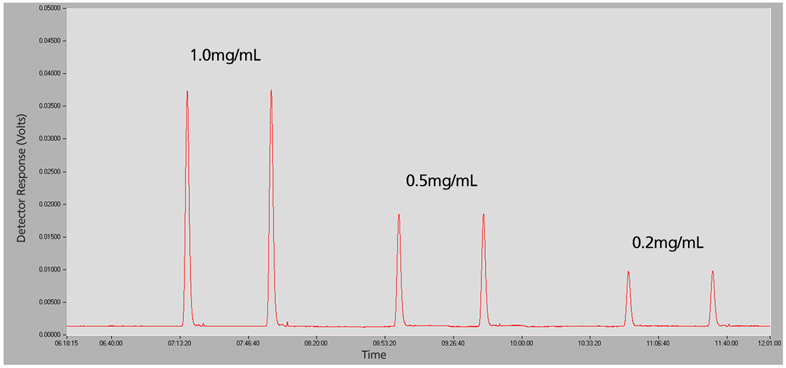
Figure 3. IR5 MCT concentration signal. PE copolymer sample analyzed by GPC at standard conditions, with varying concentration.
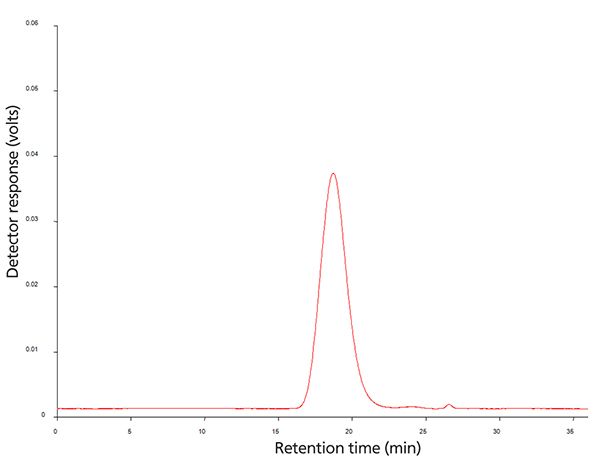
Figure 4a. PE copolymer. Injection volume 200µL, concentration 1.0mg/mL
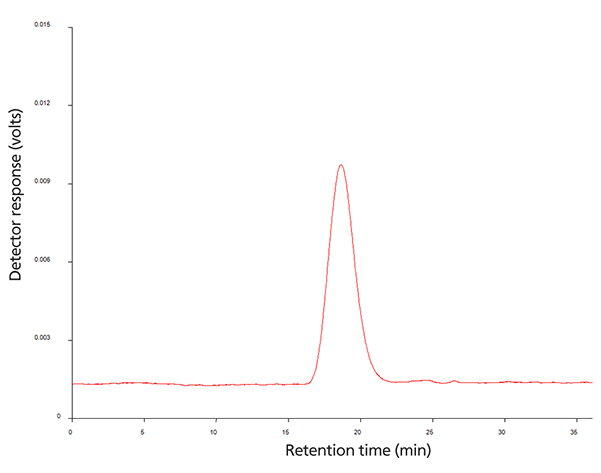
Figure 4b. PE copolymer. Injection volume 200µL, concentration 0.2mg/mL
Additionally, the flow through cell allows direct connection of the detector after the GPC columns. Continuous absorbance chromatograms at selected IR bands are collected, without removal of the mobile phase. This results in very precise and accurate determination of the chromatograms, being a quantitative method in all the molecular weight range, from the low molecular weight fractions to very high molecular weight.
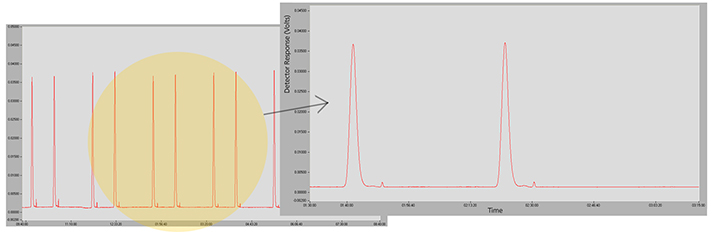
Figure 5. IR5 MCT concentration signal. PE copolymer sample injected at standard conditions (see experimental section). Consecutive injection of 6 vials, two injections per vial with no dilution. Detail insert showing the IR concentration signal stability.
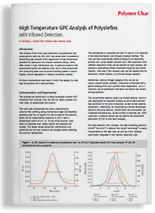
Multiple Detection GPC/SEC Systems
Triple detection (combination of concentration, viscosity and light scattering detectors) is the most comprehensive GPC/SEC technique, providing accurate molecular weight distributions as well as polymer architectural information. Determination of both absolute molar mass by light scattering and intrinsic viscosity by a capillary viscometer after the GPC/SEC separation, requires the measurement of polymer concentration at every retention volume slice. This means that the triple-detector GPC/SEC data accuracy and precision greatly benefit from an improved concentration signal. The low detection limit achievable by the filter-based IR detection also expands the log M range in which accurate, measured, not extrapolated, data is available for the Mark-Houwink plot. Absolute molar mass and intrinsic viscosity are accurately measured at the chromatogram tails beyond what other traditional detection techniques allow.
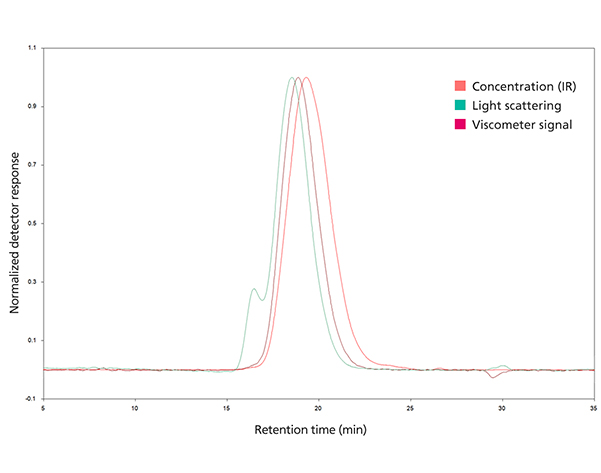
Figure 6. Triple detector chromatograms. SRM 1476 branched PE, analyzed at standard conditions.
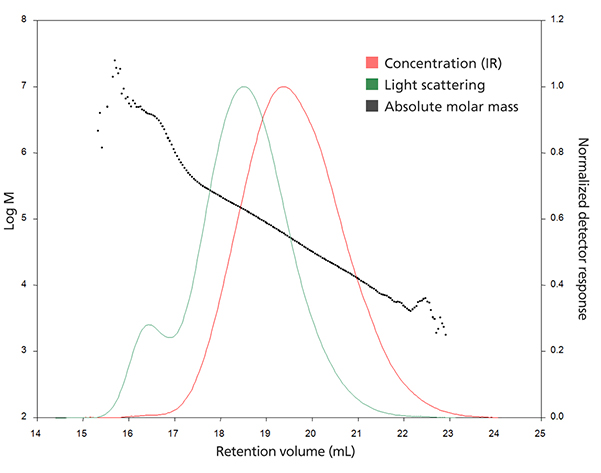
Figure 7. Absolute molar mass vs retention volume by combined light scattering and IR concentration detectors
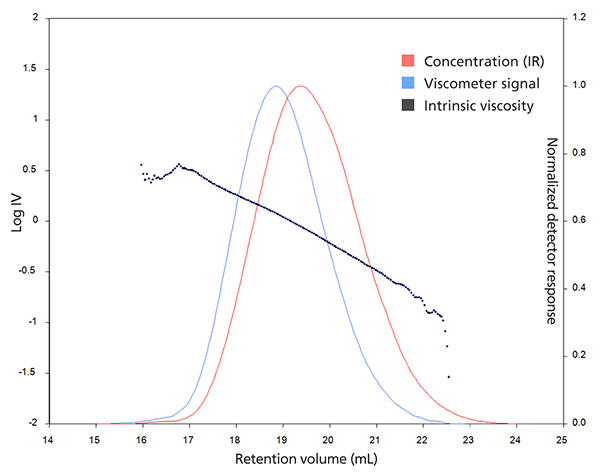
Figure 8. Intrinsic viscosity vs. retention volume from specific viscosity and IR concentration detectors.
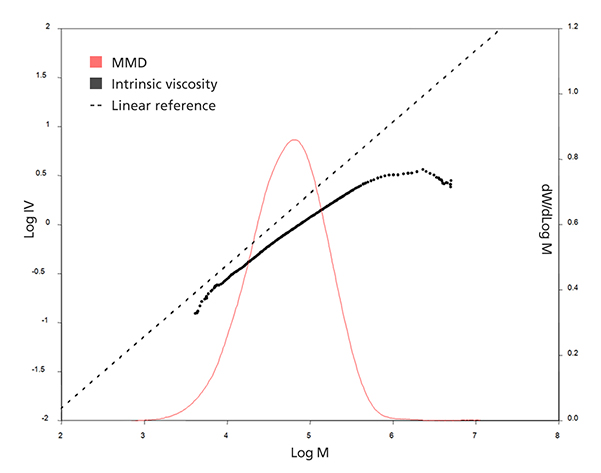
Figure 9. Mark-Houwink plot by GPC/SEC analysis with triple detection, with IR concentration detector.
Composition Detector
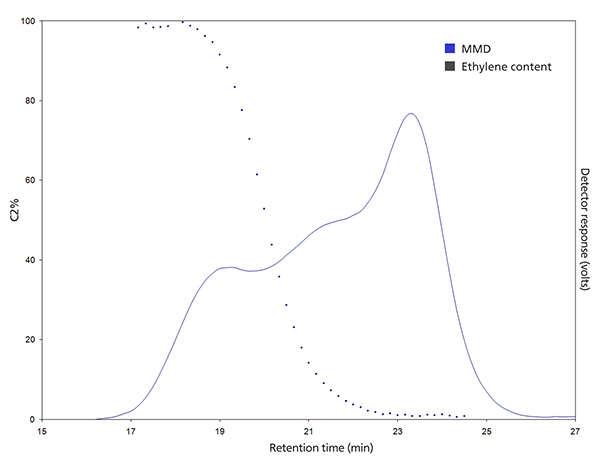
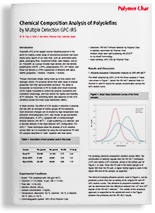
Multiple band Infrared detectors are sensitive to chemical composition in PE and PP copolymers. IR4 and IR5 MCT modern detectors based on narrow band optical filters are sensitive enough to be used in standard GPC/SEC analysis conditions or even at reduced injected mass. A single detector, using only one measurement cell, and in an extremely simple set-up, provides additional information on the compositional drifts across the molar mass distribution without additional hardware and, most important, without compromising the quality of the separation. Applications are found in pipe grade resins bimodal HDPE in which low amounts of comonomer are added to the high molar mass components (Figure 10), LLDPE based on different catalyst technologies (SSC data shown in Table 1) and Ethylene-Propylene Copolymers (Figure 11).
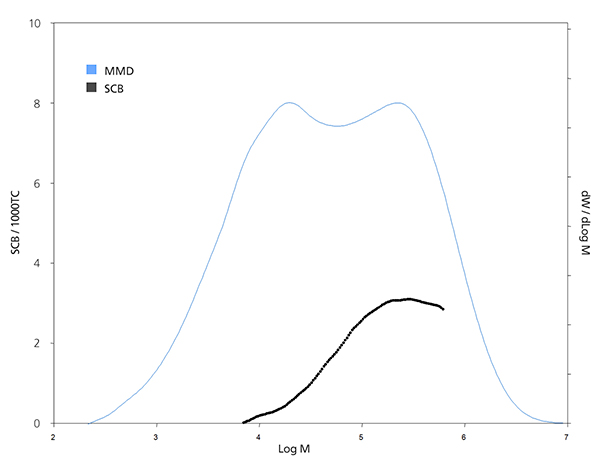
Figure 10. Bimodal HDPE with very low content of comonomer, in a tailored distribution, as measured by GPC with IR5 MCT under standard GPC/SEC conditions.