Introduction
Polyolefin technology has made remarkable progress in the last decades through the development of new technologies that allow more control of the polymer structures by the product designers. Application-customized materials are produced with varying and increasing microstructure complexity. Polymer characterization provides information about the molecular structure which builds a bridge between polymer properties and polymerization conditions. 1,2
In most industrial polyolefins there are essentially two molecular parameters of interest: the MMD (Molar Mass Distribution) and the CCD (Chemical Composition Distribution), which are manipulated to impart desired properties to the final product. The MMD tells how much material of a certain molar mass is present. The CCD tells how much material of certain chemical composition, or comonomer content, is present.
Separate information on MMD and CCD, which are routinely determined by SEC/GPC (Size Exclusion Chromatography, Gel Permeation Chromatography) and TREF (Temperature Rising Elution Fractionation) or CRYSTAF (Crystallization Analysis Fractionation)3respectively, although important and in many cases sufficient, is not enough to fully characterize a Polyolefin resin and the full bivariate distribution is required.4
Hyphenated techniques, such as SEC-FTIR and TREF-LS that carry out a separation along one molecular axis and determine some average of the other, have become popular in the last years.2,5 However, those result in some information loss, the extent of which depends on the method employed and on the shape of the CCD x MMD bi-variate distribution of the materials (Figure 1).

Figure 1: Contour plot of the CCD x MMD and individual distributions as measured by TREF and GPC/SEC.
Thus, it is generally preferable to access the full CCD x MMD, which has been traditionally a challenging and time-consuming task.6
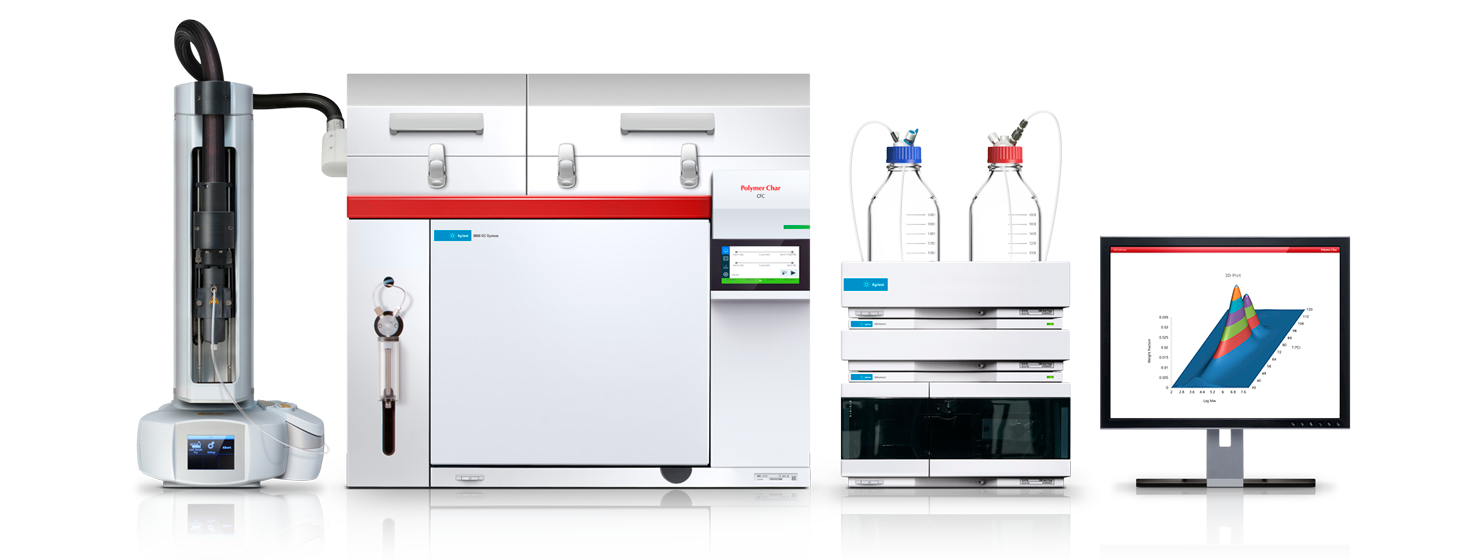
With the introduction by Polymer Char of the CFC automated analytical-scale instrument for polyolefin cross-fractionation7 it is now possible to fully characterize complex comonomer / molar mass distributions on the order of hours instead of days and without the need of intermediate manual steps, in a bench-top instrument. Very high resolution can be achieved in both dimensions by using optimized analytical columns, analysis conditions, and sample sizes.
Experimental
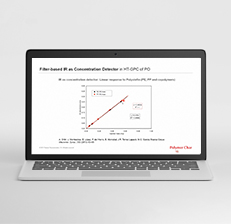
The instrument is based on a high-resolution analytical TREF apparatus combined with a dedicated GPC/SEC columns oven and equipped with a high-temperature autosampler for automated sample preparation. Polymer detection is made through an IR5 MCT infrared detector for maximum sensitivity in polyolefin applications, including chemical composition detection for copolymers. The superb sensitivity of IR5 MCT allows detection of even the smallest fractions thus ensuring a reliable and accurate determination fo the bivariate distribution without compromising resolution.
The polymer samples are placed in solid form (8-40 mg) into disposable vials, which are brought to the autosampler tray. The instrument automatically fills the vials with a proper solvent, o-DCB or TCB, and dissolves them at temperatures of 140ºC-160ºC for 60-90 minutes as programmed under gently shaking. The instrument works by loading the polymer solution into the TREF column where it is crystallized by cooling down the TREF oven, and subsequently eluting the fractions in step-wise temperature increments towards the GPC columns.
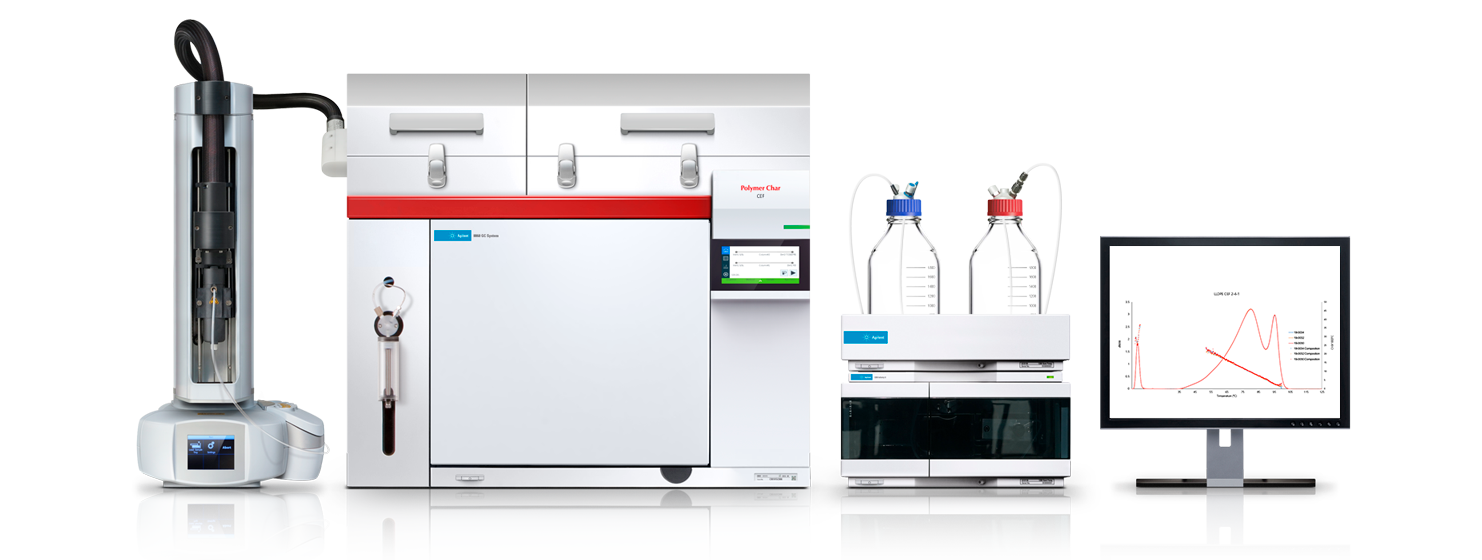
A series of chromatograms are collected at the different fractionation temperatures (Figure 2). Those chromatograms describe the molar mass distribution of every compositional fraction. The relative areas of the individual chromatograms reflect the compositional heterogeneity while their retention time and shape relates to the molar mass dimension.
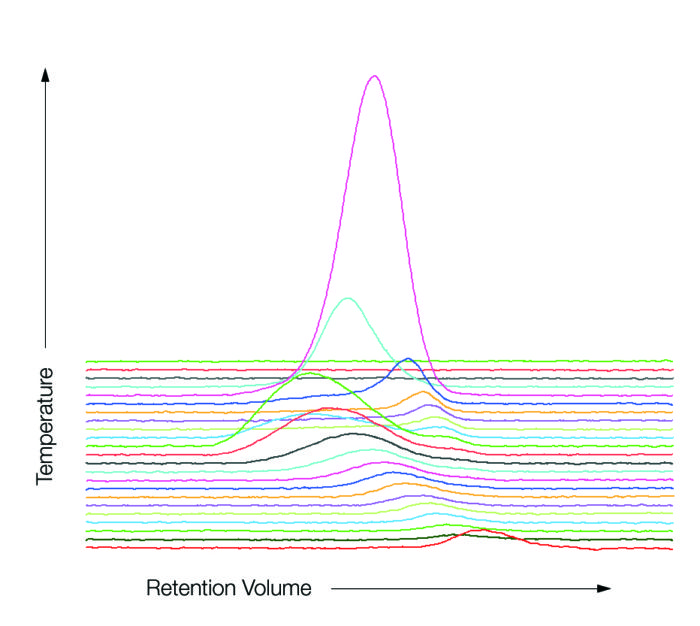
Figure 2: GPC/SEC chromatograms collected at 23 different fractionation temperatures, showing both the molar mass and the compositional heterogeneity of the analyzed PE blend
Experimental conditions can be varied to optimize resolution and analysis time depending on the chemical composition distribution, by setting any number and arrangement of temperature fractionation points as required: evenly distributed in all the range, every 2ºC or 3ºC, for a typical Z-N LLDPE sample having broad CCD, or concentrating the fractionation points in a narrower temperature range around 85ºC – 95ºC for HDPE, which tends to have quite narrow composition distribution. Sample size is also optimized according to the fractionation conditions in order to prevent overloading of the SEC/GPC columns.
An SEC/GPC columns calibration curve is established so that MMD and molar mass moments are calculated at every elution temperature. The relative weight fraction is obtained from the area under each chromatogram and it is combined with the MMD of the individual fractions in order to obtain the full CCD x MMD distribution for the sample. All the data processing and calibration is performed within a dedicated and comprehensive software package which additionally provides the TREF profile and MMD for the whole sample.
Results and discussion
A synthetic blend of two single-site-catalyst polyethylene-co-octene copolymers having different densities and molar masses was analyzed automatically using the CFC instrument. The full CCD x MMD is directly measured with high resolution in 12 hours by elution of 24 TREF fractions into the GPC columns.
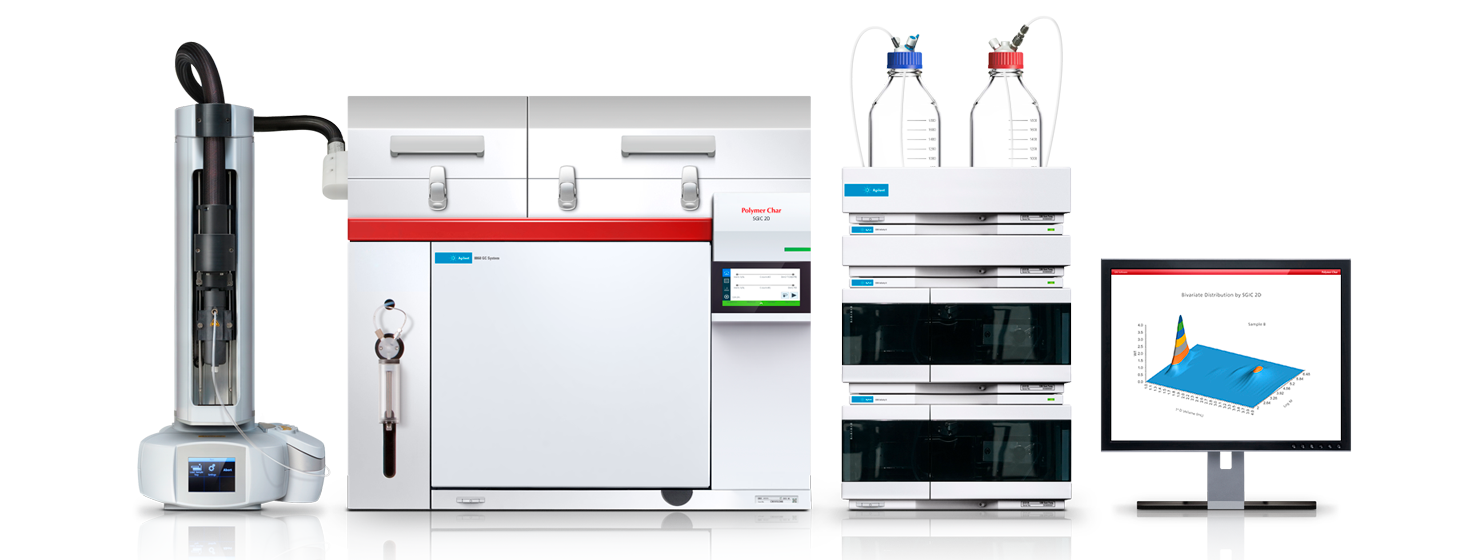
The bivariate distribution is presented in a tridimensional surface plot (Figure 3), which can be processed in several ways within the software. The two components are observed in the graph, which also reveals clearly their distinct position in the molar mass / chemical composition plane. In this case more comonomer was added to the higher molar mass component of the blend, as highlighted by the lower temperature peak which appears at a higher value in the log M scale.
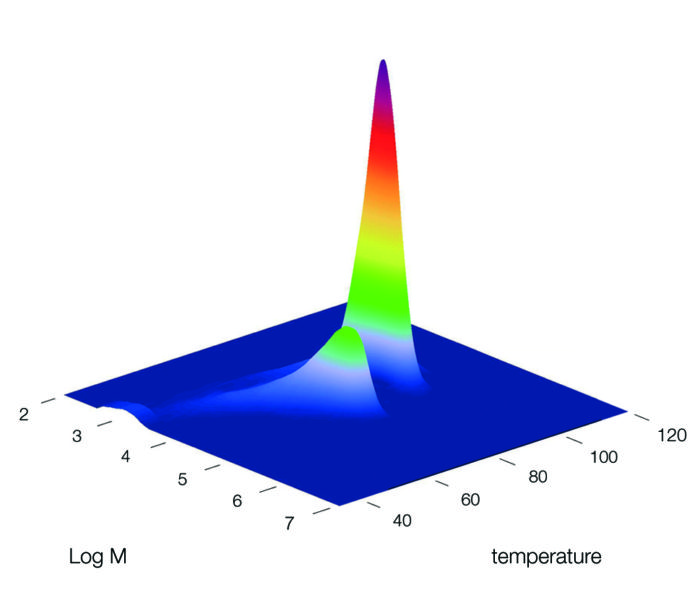
Figure 3: MMD x CCD surface plot of a two-component PE blend.
The TREF profile is recovered from the fractions relative weights using a smoothing fitting routine to obtain the differential weight fraction versus elution temperature.
The two dimensional data is also processed to obtain the molar mass distribution of the whole sample by integration over the temperature dimension providing all the distribution averages as well as overall polydispersity. Additionally, the software allows the integration of data across specific temperature ranges in order to study the MMD at different comonomer levels.
The microstructural characterization of different types of polyolefin products can benefit from the automation of this powerful technique:8 ZN-LLDPE, polypropylene impact copolymers, dual reactor products or polymer blends and also high density polyethylene with low comonomer levels.
The result of this cross-fractionation analysis can be presented as contour plots which map the molecular structure of polyolefins (in terms of comonomer and molar mass). Families of related or competitive products are easily compared in this way (Figure 4) helping the product designer identifying the relevant structural features and assisting to establish basic property-structure relationships.
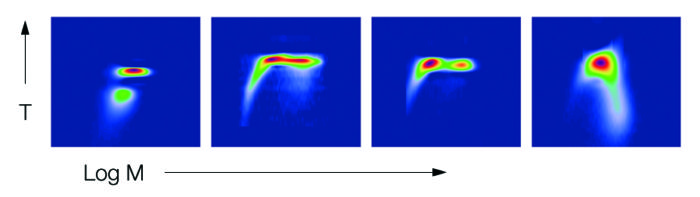
Figure 4: Contour plots of different PE products showing distinct microstructural features.
Conclusions
A new integrated benchtop instrument is introduced, which enables the direct measurement of the CCD x MMD bivariate distribution in polyolefins in the order of hours, and in a fully automated way. This method is capable of describing the resin microstructure without information loss. Applications are found in all types of polyolefins when accurate knowledge of their microstructure is required.
References
- Zhang, Macromol Symp. 282 (2009), 111-127.
- W. Yau, D. Gillespie, Polymer 42 (2001) 8947-8958.
- Monrabal, in “‘Encyclopedia of Analytical Chemistry’’, R. A. Meyers, Ed., John Wiley & Sons Ltd., 2000.
- Nakano, Y. Goto, J. Appl. Polym. Sci. (1981), 26, 4217.
- W. Yau, Macromol. Symp. 2007, 257, 29–45.
- Faldi, J.B.P. Soares, Polymer 42 (2001) 3057-3066.
- Ortin, B. Monrabal, J, Sancho-Tello, Macromol. Symp. 257 (2007), 13–28.
- Li Pi Shan, D. Gillespie, L. Hazlitt, Ecorep 2005. Lyon.