Advantages of Size Exclusion Chromatography (SEC/GPC) for polyolefins
- March, 30 2021
- Category: GPC/SEC

Polyolefin resins have become complex polymers by design, achieved with multi-reactor processes and the incorporation of comonomers that improve their performance for the desired application. This design complexity requires advanced methods of analysis, as the average properties measured by melt index and density techniques are not enough to define the microstructure of these polymers.
Size Exclusion Chromatography (SEC) – also called Gel Permeation Chromatography (GPC) – offers a great advantage in this area, as separating the polyolefin by its molar mass allows the study of its distribution and chemical structure, instead of relying on the average values provided by melt index and density techniques. The SEC technique is considered a pillar in polyolefin characterization, and the Molecular Weight Distribution (MWD) has become a fundamental structural parameter to control. In some cases, the MWD alone cannot explain resin performance, and other parameters such as Short-chain Branching (SCB) and Long-chain Branching (LCB) must also be considered.
When analyzing the microstructure of polyolefins, it is important to approach this challenge from different angles because, depending on the concrete type of resin, a specific technique – or the combination of different techniques – might provide more information.
In this article we have focused on the SEC/GPC technique, and classified different polyolefin types according to the importance of characterizing them by Size Exclusion Chromatography.
1. Bimodal HDPE (High Density Polyethylene):
The chemical structure of a linear polyethylene homopolymer is solely defined by its Molecular Weight Distribution. However, in multiple-site catalyst systems (as in the case of Bimodal HDPE) the intermolecular incorporation of the comonomer is not uniform, so Size Exclusion Chromatography must be combined with a chemical composition detector (Infrared technology) to understand how the comonomer content has been incorporated along the MWD, and to get a good picture of the molecular weight and chemical composition interdependence (Figure 1).
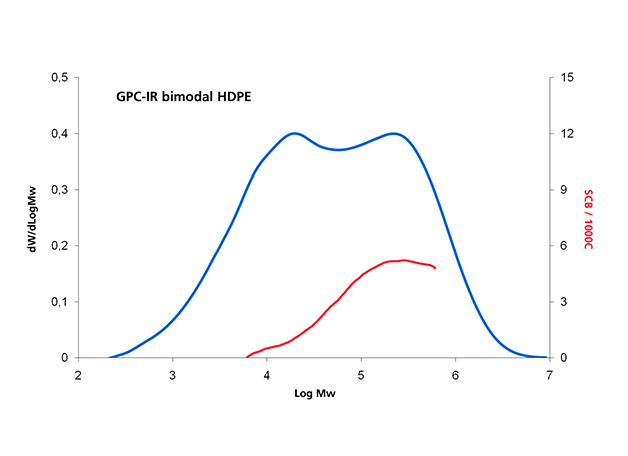
Figure 1. Bimodal HDPE analyzed by GPC-IR. Molecular Weight Distribution (blue line) and Short Chain Branching distribution (red line).
The dual-reactor process adds complexity to the polymer’s microstructure, so SEC is a key technique not only for product development but also for production control, where melt indexers may provide similar results for very different products.
Read more about why newly developed polymer resins are more challenging to control in production plants
2. LDPE (Low Density Polyethylene):
LDPE can be obtained by high pressure free radical polymerization, resulting in complex microstructures where side chain branches (mainly ethyl and butyl) are obtained through chain transfer reactions without the need of comonomer incorporation. The presence of Long-chain Branches (LCB), and the possibility of incorporating polar comonomers like vinyl acetate, are features of the free radical polymerization process.
Measuring the molecular weight distribution and long-chain branching distribution is the most important characterization task in these complex LDPE resins, possible with the use of a SEC instrument coupled with a Viscometer and/or Light Scattering detectors (Figure 2).
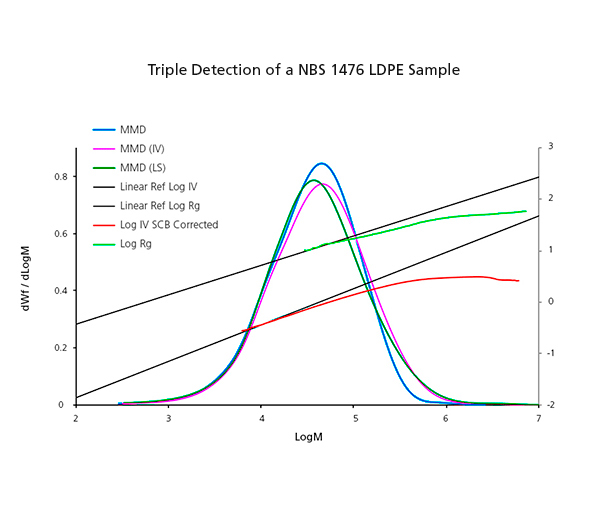
Figure 2. Analysis of an LDPE sample by GPC-IR with Viscometer and Light Scattering detectors.
3. Ethylene-Propylene copolymers:
In the case of polypropylene copolymers, typically Ethylene Propylene (EP) copolymers, the insertion of ethylene into the growing PP chain will result in disruption of the methyl sequence and thus reduce the crystallizability.
Determining the Molecular Weight Distribution in ethylene-propylene copolymers is important, but complementing this information with how the ethylene is incorporated along the MWD will help us understand the performance differences in these types of samples. Therefore, for ethylene-propylene copolymers, the SEC technique is most discriminating when it is coupled to a multiband Infrared (IR) detector that delivers the comonomer content along the molecular weight distribution (Figure 3).
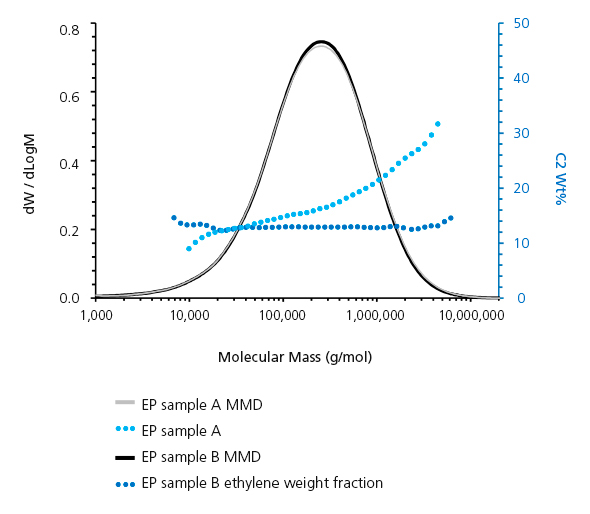
Figure 3. Two Ethylene-Propylene samples analyzed by GPC-IR. Molecular Weight Distribution (solid lines) and Ethylene content (dotted lines)
The same can be said about Vinyl Acetate copolymers or others with carbonyl groups but, in this concrete case, an infrared detector with bands sensitive to carbonyl groups would be a key complement to the SEC system.
4. UHMW (Ultra High Molecular Weight polyolefins):
Ultra High Molecular Weight polyolefins are challenging materials for SEC instruments due to the complexity that they add to each analytical step, from sample preparation to injection into the SEC columns. However, Size Exclusion Chromatography still remains the most important technique for characterizing UHMW polyolefins and measuring those ultra high molecular weights.
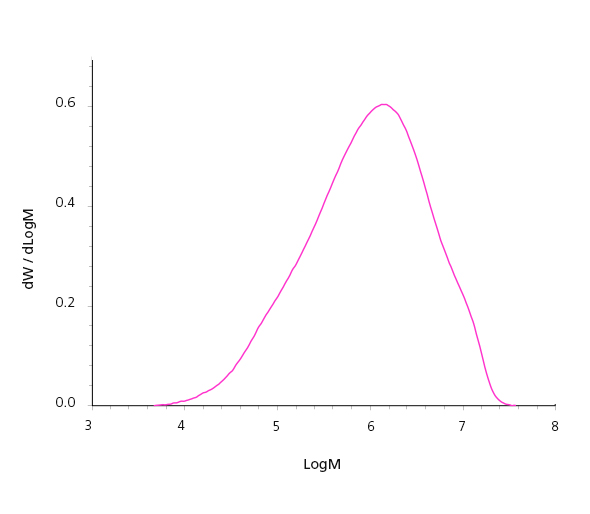
Figure 4. UHMWPE sample analyzed by GPC-QC (IV = 21 dl/g)
5. LLDPE (Linear Low Density Polyethylene):
When LLDPE is produced in a multiple-site catalyst system, the intermolecular incorporation of comonomer is not uniform and, therefore, there is further need to determine the Chemical Composition Distribution (CCD) of the resin. In that case, CCD techniques such as TREF, CEF, CRYSTAF, or TGIC become their main characterization tool.
Read more about this topic: Why it is important to analyze the Chemical Composition Distribution in polyolefins
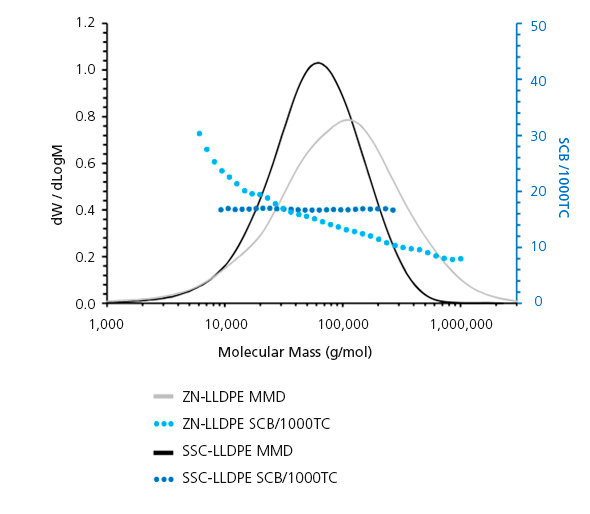
Figure 5. Molar Mass Distribution and Short Chain Branching distribution of single-site (SSC) vs. multiple-site (ZN) catalyst LLDPE samples
References
Polyolefins: 50 years after Ziegler and Natta I. Kaminsky, Walter (Ed.). Polyolefin Characterization: Recent Advances in Separation Techniques. B. Monrabal