Why it is important to analyze the Chemical Composition Distribution in polyolefins
- June, 21 2021
- Category: Chemical Composition Distribution
Polyolefins with heterogeneous chemical composition are becoming prevalent in the industry. These resins are produced by incorporating comonomers into the main chain in order to reduce their crystallinity and extend the range of product performance. To define these copolymers, characterization by molar mass (the most popular characterization technique) will not tell us about the intermolecular distribution of comonomer into the linear chains. Instead, we need to find out about its chemical composition or comonomer incorporation parameter.
To define the microstructure of heterogeneous resins in terms of composition, it is necessary to provide the full Chemical Composition Distribution (CCD), also referred to as the Short-chain Branching Distribution (SCBD) in the case of ethylene-α-olefin copolymers.
In the case of homogeneous resins – made by metallocene chemistry and other single-site catalysts – measuring the chemical composition distribution provides little information, because the microstructure of these resins is rather simple.
Therefore, when new catalysts and processes are used to design complex multimodal resins, CCD becomes the most important structural parameter to define them, which is also the most discriminating distribution in complex polyolefins.
Application Examples. Identifying different components in polyolefins.
Let’s look at 3 real examples of heterogeneous polyolefins to better understand the importance of characterizing them by a CCD technique to define their microstructure.
These 3 polyolefins have been analyzed by Crystallization Elution Fractionation (CEF) technique with an on-line infrared (IR) detector capable of measuring total concentration and CH3 groups at the same time. This measurement – when using the proper calibration – provides information about Short-Chain Branches along the Chemical Composition Distribution of the polyolefin.
The separation according to crystallizability (temperature scale) combined with the direct on-line measurement of comonomer fraction (by IR), reveals the different components that a polyolefin has in composition, and the corresponding amount of short-chain branches for each component. Moreover, the polyolefin’s intramolecular structure (random or block) may also be revealed.
1. LLDPE
The graph below (Figure 1) shows the results of an ethylene-octene copolymer. Looking at the concentration signal (dW/dT) we can identify the components of this resin according to its regularity/crystallinity:
The peak on the right side corresponds to the most crystalline component of this resin, the homopolymer, which has the highest elution temperature. The number of short-chain branches (measured as CH3 groups per 1000C) for this peak is close to zero, as it is expected for a homopolymer.
The wider peak in the middle corresponds to the copolymer fraction, which has a heterogeneous distribution of short-chain branches across the elution temperature (SCB values increase as the temperature decreases).
Finally, the leftmost peak corresponds to the soluble/amorphous fraction, which never crystallized because it has the most amorphous components within the resin. This fraction shows the highest value of short-chain branches among all the components of this LLDPE resin.
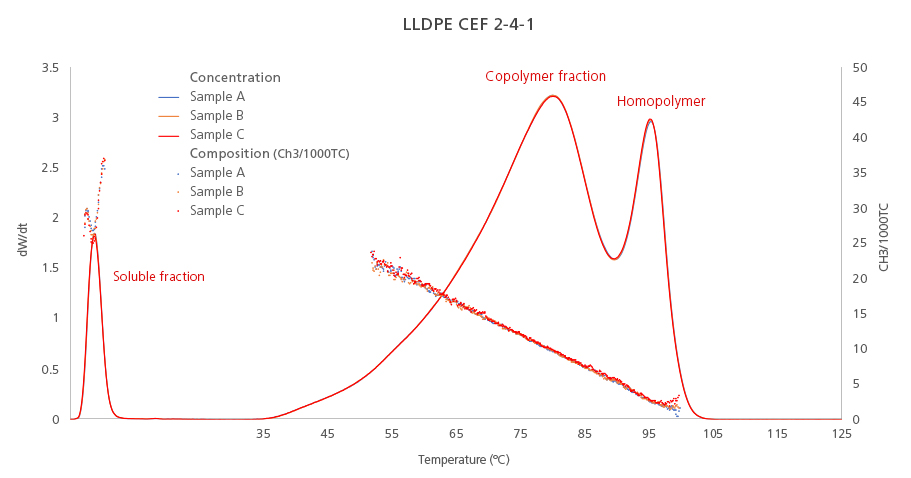
Figure 1. Chemical composition distribution (solid lines) and short-chain branching distribution (dotted lines) of an LLDPE resin. CEF analysis by triplicate.
2. Multicatalyst / Multireactor resins
In Multicatalyst / Multireactor resins we can identify even more chemically-different peaks.
The graph below (Figure 2) shows the results of an LLDPE resin produced by a Multicatalyst / Multireactor process. The PE homopolymer peak (the rightmost peak) has the lowest quantity of short-chain branches (orange plot) and is the most crystalline. The rest of the resin’s components have a lower density and are less crystalline, and so they appear at lower temperatures. This crystallinity attribute is inversely related to the number of short-chain branches (CH3 groups per 1000C) measured: as the the number of short-chain branches increase, the resin’s regularity (or crystallinity) decreases, reaching the maximum SCB value in the soluble/amorphous fraction peak (left side of the plot).
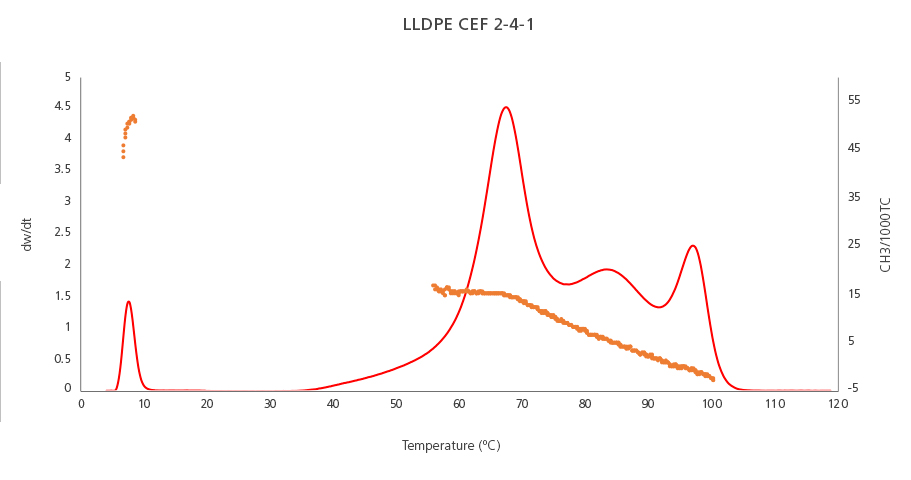
Figure 2. Chemical composition distribution (red line) and short-chain branching distribution (orange plot) of an LLDPE resin produced by a multicatalyst/multireactor process.
3. PP copolymers
The graph below (Figure 3) shows the results of an Ethylene-Propylene copolymer. The peak on the right side can be identified as Isotactic Polypropylene. We arrive to this conclusion thanks to the crystallization temperature where it appeared, and the methyl frequency measured by IR (333 CH3/1000C). Both attributes identify the PP molecule unequivocally.
In the center of the plot there is a short and wide peak with a low level of methyl groups. This fact, together with its crystallization temperature, indicates that the small peak is an ethylene-rich fraction.
Finally, on the left side of the plot we find the soluble fraction peak, which has quite a high level of short-chain branches (CH3/1000C), but not as high as the polypropylene homopolymer peak on the rightmost side, therefore we can conclude that this soluble fraction is a mixture of atactic polypropylene and a rubber EP component.
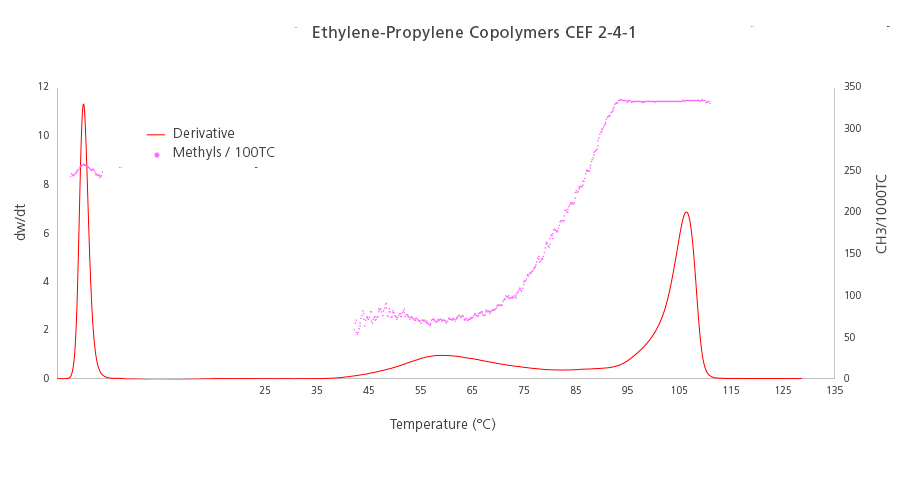
Figure 3. Chemical composition distribution (red line) and short-chain branching distribution (pink plot) of an ethylene-propylene copolymer.