Chemical Composition measurement in GPC/SEC analysis. Differentiating polyolefins with similar Molar Mass Distribution.
- July, 6 2021
- Category: Chemical Composition Distribution, GPC/SEC
The simultaneous analysis of concentration and chemical composition in Gel Permeation Chromatography (GPC) or Size Exclusion Chromatography (SEC) is of significant interest for today’s complex polyolefin copolymers.
In polyethylene and copolymers, chemical composition is centered around the study of short-chain branches, created by the incorporation of comonomers into the main chain.
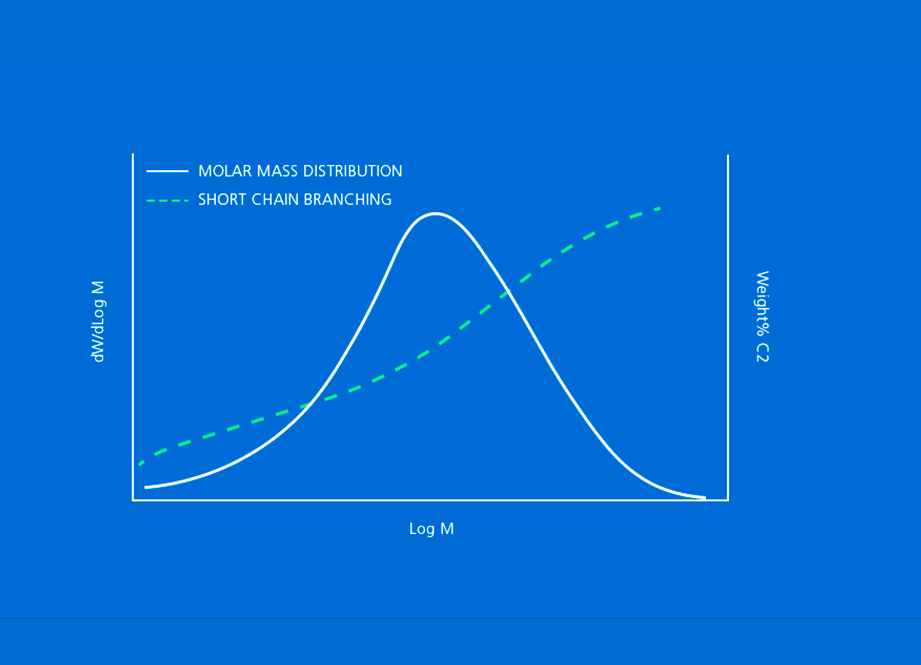
The measurement of short-chain branching adds a new dimension to the conventional GPC/SEC technique that may be critical when dealing with resins that have very similar Molar Mass Distribution (MMD) but different incorporation of the comonomer. Analyzing such polyolefins by standard GPC (without short-chain branching information) may make us think that they are equal, but if we add the composition signal (achieved with Infrared detection), we will see differences in their comonomer distributions that will set them apart. These differences will influence the resins’ physical properties, morphology, and ulterior performance.
Let’s look at a few examples with different types of polyolefins.
Bimodal HDPE
A very clear case of the importance of measuring Short Chain Branches along the MMD curve is bimodal HDPE products. When using high sensitivity Infrared Detectors, small differences in SCB in the high molar mass range can be detected, as it can be seen in Figure 1, depicting an analysis of two different bimodal HDPE products with good sensitivity for a low number of SCB.
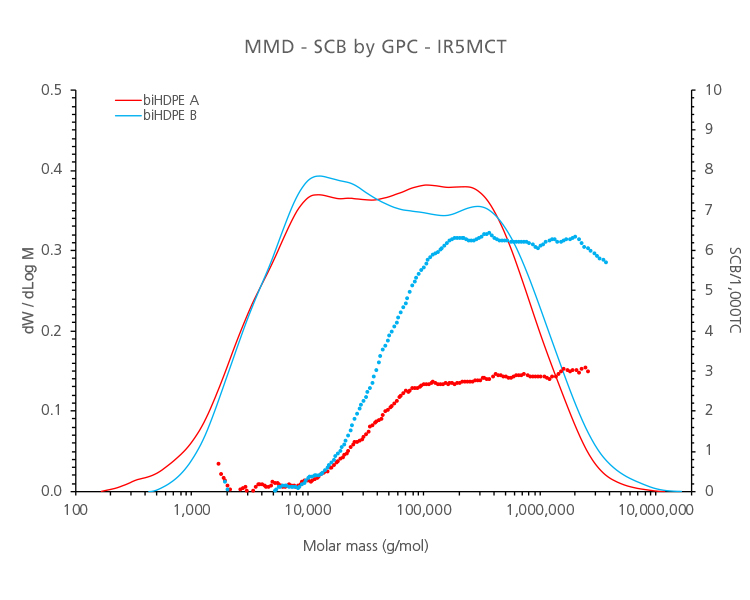
Figure 1. Analysis by GPC-QC of 2 different bimodal HDPE samples. Molar mass distribution (solid lines) and short-chain branching distribution (dotted lines).
LLDPE
In the next example we can see the GPC-IR analysis of a Ziegler-Natta LLDPE showing a clear drift of SCB along the molar mass separation, in contrast to the uniform comonomer incorporation of single-site catalyst products.
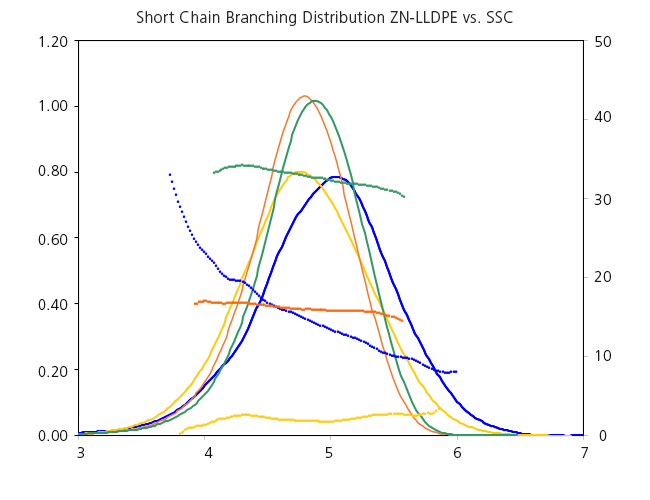
Figure 2. Analysis by GPC-IR of 4 LLDPE samples: 3 single-site catalyst (green, orange, and yellow lines) and 1 Ziegler-Natta (blue lines).
Ethylene-propylene copolymers
Another important type of polyolefins are ethylene-propylene copolymers. In Figure 3 we can see two different industrial copolymers whose Molar Mass Distributions are practically equivalent but have very different profile of ethylene incorporation along their MMD. One of them is quite homogeneous, while the other has more ethylene in the high molar mass fractions. Their properties are therefore quite different, and the online composition measurement by IR helps to identify them.
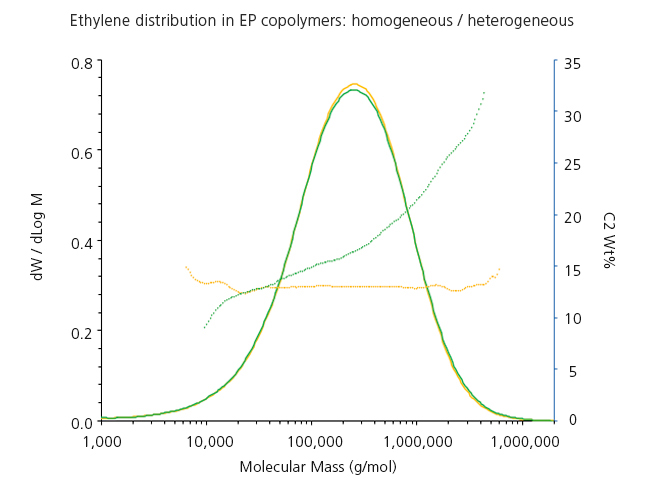
Figure 3. Analysis by GPC-IR of 2 ethylene-propylene copolymers with simmilar MMD but different short-chain branching distribution: homogeneous (yellow) vs heterogeneous (green).
3 Comments
IN the above graphs, the SCB starts showing at >Mw=1000 and ends much below the highest MW of the samples. Specifically, they are: Bimodal HDPE about 1,700-4,000,000MW, LLDPE about 6,000-1,000,000MW, and PP: about 7,000-6,000,000MW. Is there a MW range that SCB can be determined (detected) accurately while outside the low/upper MW limits, detection is not reliable? We use Polymer Char GPC in Shanghai area for the analysis of bimodal HDPE and typically get very high SCB values towards the low MW end (the lower MW the higher SCB) and it then drops at around 2,000 MW. BTW, going higher in MW from that point on, we see SCB values that resemble the trends showing in your HDPE curve.
Linn, thank you for your interest and your comment.
In the lower and upper MW limits, the chromatogram signal is low due to the low concentration of sample, so it becomes difficult to obtain accurate results without introducing noise to the chemical composition distribution results. For this reason, we ignore the lowest and highest molar mass points, and the cut-off point depends on how narrow or broad the sample’s distribution is. The plotted range shown in the graph doesn’t affect the bulk SCB result, because the bulk SCB is calculated from the chromatogram’s area, however, being able to study the SCB distribution is of great value especially in dual-reactor high density polyethylene resins.
The infrared detector can measure methyl-chain end groups present in the polymer. This explains why at high elution volumes the methyl distribution is also higher, because the proportion of methyl groups increases with the short length of the molecules. The chain ends correction option available in the GPC One software is a useful tool to accurately report short chain branching distribution.
Your lab is number one.